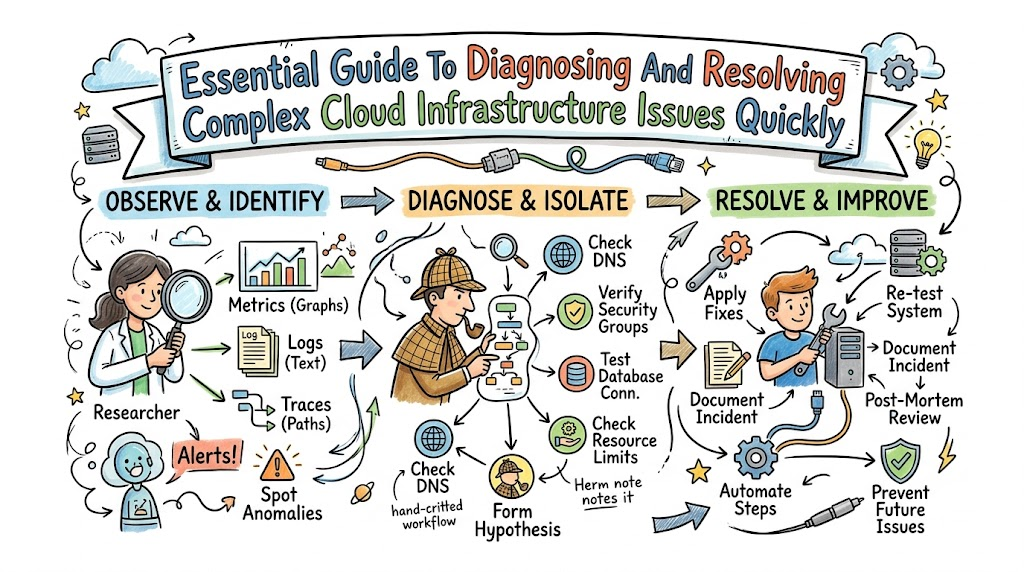
Modern cloud architectures offer unprecedented flexibility and scale, but distributed systems inevitably introduce subtle operational challenges. When services experience unexpected downtime, degraded network performance, or configuration drift, engineers must diagnose the root cause immediately. Consequently, effective troubleshooting requires a structured methodology rather than haphazard guesswork. By mastering systematic diagnostics, engineering teams can rapidly identify failure points, minimize downtime, and keep production systems resilient under heavy workloads.
To build dependable environments, forward-looking engineering teams partner with specialized service providers like Cloudopsnow to implement robust diagnostic workflows. Furthermore, resolving intricate infrastructure incidents requires an organized approach that blends deep observability, root-cause isolation, and disciplined automation. When complex distributed systems fail, even minor errors can escalate into widespread service disruptions. This guide explores the core principles of infrastructure troubleshooting and provides actionable strategies to diagnose cloud issues like an expert.
Key Operational Concepts You Must Know
Understanding Observability Triad: Metrics, Logs, and Traces
Effective cloud troubleshooting relies directly on the three pillars of observability: metrics, logs, and distributed traces. Metrics provide quantifiable health measurements over time, such as CPU utilization, memory pressure, and request counts. Logs capture discrete, time-stamped events that detail specific system activities or application failures. Meanwhile, distributed traces follow individual user requests as they traverse multiple microservices, pinpointing the exact location of performance bottlenecks.
+-------------------------------------------------------------------+
|                        OBSERVABILITY TRIAD                        |
+-------------------------------------------------------------------+
|  1. METRICS        | Aggregated numeric data (CPU, Memory, RTT)    |
|  2. LOGS           | Discrete contextual records (Errors, Audits)  |
|  3. TRACES         | End-to-end request journeys (Span Latency)    |
+-------------------------------------------------------------------+
When diagnosing complex production outages, engineers must correlate these three distinct telemetry signals. A sudden spike in system metrics often alerts you to an emerging operational problem. Following that alert, examining detailed error logs reveals the specific software exception causing the failure. Finally, distributed traces expose the exact microservice dependency responsible for introducing latency. Mastering this investigative flow allows teams to resolve incidents swiftly and systematically.
The Significance of Mean Time to Detection (MTTD) and Recovery (MTTR)
Operations teams measure their troubleshooting efficiency using two critical operational benchmarks: Mean Time to Detection (MTTD) and Mean Time to Recovery (MTTR). MTTD measures the total time elapsed between the initial occurrence of an issue and when your monitoring systems flag it. Conversely, MTTR measures how quickly engineers diagnose, remediate, and restore normal service operations. Minimizing both metrics remains the primary objective of any high-performing engineering organization.
[ Incident Occurs ] -------- ( MTTD ) --------> [ Incident Detected ]
[ Incident Detected ] ------ ( MTTR ) --------> [ Service Restored  ]
|<======================= Total Downtime ===========================>|
Reducing detection time requires finely tuned alerting rules that detect system anomalies before end users notice them. Meanwhile, reducing recovery time depends on clear runbooks, reliable automated rollbacks, and effective diagnostic tooling. When teams automate initial incident response workflows, they eliminate manual troubleshooting bottlenecks. Consequently, organizations achieve higher availability rates and protect their core business revenues from catastrophic downtime.
Differentiating Network Failures from Compute Bottlenecks
Engineers frequently misdiagnose system slowdowns by confusing network-level packet issues with compute-level resource exhaustion. A compute bottleneck occurs when virtual machine CPUs reach saturation or applications run out of physical memory. In contrast, a network issue stems from dropped packets, DNS resolution timeouts, or firewall security group misconfigurations. Accurately distinguishing between these two domains prevents teams from wasting precious time pursuing misleading diagnostic paths.
- Compute Bottlenecks: Manifest as elevated CPU load, memory thrashing, high swapping rates, and delayed internal process scheduling.
- Network Failures: Show up as connection timeouts, TLS handshake resets, packet retransmissions, and high Round-Trip Time (RTT).
- Storage Latency: Appears as disk I/O queuing, read/write throttling, and depleted IOPS burst credits.
To isolate the genuine problem, engineers should systematically inspect host-level telemetry before exploring deeper networking layers. If CPU and memory metrics show normal consumption patterns, testing connection pathways with packet-level diagnostic tools becomes mandatory. Furthermore, verifying security rules and routing tables helps rule out intermediate traffic filters. This step-by-step isolation strategy guarantees accurate and rapid problem resolution.
Configuration Drift and State Synchronization
Configuration drift occurs when manual updates, unscheduled hotfixes, or intermittent scripts cause a cloud environment to diverge from its intended configuration baseline. When individual instances behave differently than defined in your Infrastructure as Code repositories, tracking down system failures becomes exceptionally difficult. This variance often leads to mysterious, non-reproducible bugs that affect only a subset of your production fleet.
Target IaC Template  ========> [ Golden State: Security Group v1.2 ]
                                              |
Production Server A  --------> [ Matches: Security Group v1.2 ] (Healthy)
Production Server B  --------> [ DRIFTED: Port 443 Closed Manual Edit ] (Fails)
Mitigating configuration drift demands strict adherence to immutable infrastructure principles and continuous compliance monitoring. Teams must disable direct manual modifications in production environments entirely, enforcing all changes through automated CI/CD pipelines. Additionally, automated configuration drift detection tools should scan your cloud environments continuously to flag unauthorized modifications. Maintaining synchronized, deterministic environments ensures that your troubleshooting procedures remain consistent and predictable.
Platform Implementation vs. Culture — What’s the Real Difference?
| Diagnostic Focus Area | Platform Implementation Approach | Cultural & Mindset Approach |
|---|---|---|
| Incident Response | Configuring auto-remediation scripts, automated failover, and PagerDuty alert policies. | Conducting blameless post-mortems and learning continuously from unexpected system failures. |
| System Visibility | Deploying OpenTelemetry collectors, metric dashboards, and distributed log aggregators. | Practicing proactive observability design during initial application architecture phases. |
| Access & Security | Implementing strict IAM roles, bastion hosts, and zero-trust network boundaries. | Fostering least-privilege awareness and secure credential management across all teams. |
| Root Cause Analysis | Analyzing system stack traces, heap dumps, and low-level kernel event logs. | Encouraging cross-team collaboration to diagnose interconnected microservice failures. |
Technical Diagnostic Tools vs. Engineering Discipline
Platform implementation focuses primarily on the software utilities, dashboard platforms, and automation scripts deployed to support diagnostics. Organizations invest heavily in application performance monitoring (APM) suites, centralized log storage, and synthetic testing systems. While these tools provide essential visibility, they cannot resolve complex outages on their own. Without a disciplined troubleshooting strategy, an abundance of tools often overwhelms engineers with conflicting telemetry data.
Cultural discipline, on the other hand, governs how engineering teams approach unexpected system failures. A resilient operational culture encourages engineers to form evidence-based hypotheses, verify assumptions methodically, and document every diagnostic step. When a culture values systematic inquiry over panic-driven reactions, teams isolate root causes much faster. Therefore, blending sophisticated telemetry platforms with a calm, disciplined engineering mindset produces exceptional operational stability.
Establishing Blameless Incident Reviews
To continuously improve troubleshooting capabilities, organizations must institutionalize blameless post-mortem reviews after every major production incident. A blameless review focuses entirely on uncovering systemic architectural weaknesses, inadequate tooling, or flawed operational processes. The objective is never to assign personal fault to the engineer who triggered the failure. When engineers feel safe admitting mistakes, they provide honest, detailed accounts of what transpired during the incident.
   +------------------------------------+
   |     Production Incident Occurs     |
   +------------------------------------+
                     |
                     v
   +------------------------------------+
   |   Blameless Post-Mortem Analysis   |  <-- Focus on systemic process gaps
   +------------------------------------+
                     |
                     v
   +------------------------------------+
   |   Automated Guardrails & Alerts    |  <-- Implement resilient safeguards
   +------------------------------------+
These collaborative reviews generate high-priority action items that strengthen the platform against similar disruptions in the future. Teams identify gaps in their alert coverage, enhance diagnostic runbooks, and build automated guardrails into their deployment pipelines. This continuous feedback loop transforms painful production outages into valuable learning opportunities. Over time, this cultural commitment creates an antifragile infrastructure that withstands unexpected production stress.
Real-World Use Cases of Modern Operations
Diagnosing Intermittent Microservice Cascading Timeouts
In a distributed microservice architecture, a minor performance delay in a downstream service can quickly trigger a catastrophic cascading failure. For instance, when a product catalog database encounters resource exhaustion, upstream payment and checkout services may hang while waiting for responses. As connection pools exhaust, these upstream services start rejecting incoming user requests entirely. Troubleshooting this scenario requires engineers to trace the dependency chain backward to find the origin of the latency.
[ API Gateway ] ---> [ Order Service ] ---> [ Inventory Service ] ---> [ DB (Locked) ]
       |                    |                       |                       |
   (Timeout)           (Thread Pool)            (Connection Pool)       (I/O Bottleneck)
   (504 Error)          (Exhausted)             (Exhausted)             (Root Cause)
Operations teams resolve these cascading failures by inspecting distributed traces to identify the exact blocking API call. They implement resilience patterns such as circuit breakers, aggressive request timeouts, and exponential backoff retries. These architectural safeguards isolate failing dependencies immediately, allowing the rest of the application to function gracefully in a degraded state. Consequently, systems maintain uptime even when individual internal components experience transient performance degradation.
Resolving Cloud Storage IOPS Throttling and Database Starvation
High-throughput transactional databases often experience sudden, unexplained latency spikes when cloud storage disks exceed their provisioned input/output limits. Many cloud disk volumes use burst-credit buckets that deplete rapidly during extended periods of heavy read and write operations. Once these credits are exhausted, the storage volume throttles operations down to its baseline performance level. As a result, database queries queue up, CPU wait times skyrocket, and the application becomes unresponsive.
- Identify Depletion: Monitor volume burst balance metrics continuously to detect credit exhaustion before throttling begins.
- Scale Storage: Migrate databases to provisioned IOPS volumes that guarantee consistent throughput independent of burst mechanisms.
- Optimize Queries: Refactor database indexing strategies and implement Redis caching layers to reduce unnecessary disk operations.
Engineers diagnose this issue by analyzing storage wait metrics alongside database query execution logs. If disk latency rises while overall CPU utilization remains low, IOPS throttling is almost certainly the culprit. Upgrading the underlying storage tier and optimizing application read patterns immediately restores throughput. This proactive storage management prevents costly database lockups and preserves smooth transaction processing.
Tracking Down Transient DNS Failures in Kubernetes Clusters
Kubernetes clusters frequently suffer from elusive DNS lookup failures that cause sudden, intermittent connection errors between internal microservices. When hundreds of ephemeral pods fire DNS queries simultaneously, the internal DNS daemon (CoreDNS) can become saturated. Furthermore, standard Linux connection tracking tables (conntrack) can drop UDP packets under heavy concurrency due to race conditions. These dropped lookups manifest as random five-second application delays that are difficult to reproduce in staging.
[ Application Pod ] ---(UDP DNS Query)---> [ Node Conntrack Table (Race Condition Drops Packet) ]
         |
    (5-Second Timeout)
         |
         v
[ Retries over TCP ] --------------------> [ CoreDNS Daemon Resolves IP Successfully ]
To diagnose these intermittent network glitches, operations engineers inspect CoreDNS latency metrics and track kernel-level packet drops using specialized eBPF monitoring tools. They remediate the issue by deploying local node-level DNS caching agents (NodeLocal DNSCache) to handle requests locally on each worker node. Additionally, switching inter-service DNS lookups to persistent TCP connections eliminates UDP packet drops entirely. This optimization stabilizes cluster-wide communication and ensures seamless internal service discovery.
Common Mistakes in Operations Engineering
Treating Symptoms Instead of Isolating Root Causes
A common pitfall in cloud operations is applying superficial, temporary fixes to clear alerts without investigating the underlying technical cause. When a virtual machine runs out of memory, simply restarting the service or rebooting the server provides only temporary relief. If a severe memory leak exists in the application codebase, the problem will inevitably recur under similar traffic conditions. Relying on reboots creates a false sense of security while allowing underlying defects to worsen.
Superficial Fix:  [ Memory Leak Alert ] ---> [ Restart Container ] ---> (Issue Recurs Later)
Root Cause Fix:   [ Memory Leak Alert ] ---> [ Capture Heap Dump ] ---> [ Patch Leak in Code ]
Engineers must treat every incident as an opportunity to perform deep root-cause isolation. Before restarting failing services, capture critical diagnostic artifacts such as thread dumps, heap snapshots, and system logs. Analyze these artifacts thoroughly to determine whether the issue stems from code defects, infrastructure bottlenecks, or external dependencies. Addressing the genuine root cause ensures that the failure mode is eradicated permanently from your environment.
Over-Alerting and Creating Alert Fatigue
Configuring excessive, overly sensitive monitoring alerts represents another critical mistake that severely undermines cloud operations. When on-call engineers receive dozens of non-actionable, low-priority notifications daily, they naturally become desensitized to incoming alarms. During a genuine production catastrophe, critical alerts can easily get lost in the overwhelming sea of background notifications. This operational noise delays response times and causes unnecessary stress for the engineering team.
Unfiltered Alerts: [ 100+ Daily Minor Pings ] ===> [ Alert Fatigue ] ===> (Critical Outage Missed)
Actionable Alerts: [ Only Actionable PIs ] =====> [ Swift Response ] ===> (Fast Incident Resolution)
To eliminate alert fatigue, organizations must enforce strict criteria for triggering high-priority on-call alerts. Every alert that pages an engineer must represent a direct threat to user experience and demand immediate manual intervention. Non-urgent warnings and informational notices should route to asynchronous Slack channels or tracking dashboards for review during standard business hours. Regularly auditing and pruning noisy alert rules keeps the engineering team focused, alert, and responsive.
Troubleshooting Without Controlled Change Tracking
Attempting to diagnose a production outage while simultaneously making multiple uncoordinated changes to the environment often turns a minor issue into a total disaster. In the heat of an incident, panicked engineers may tweak security groups, alter environment variables, and update configurations concurrently. If the system recovers, nobody knows which specific change fixed the problem; worse, these uncontrolled modifications can introduce new, hidden vulnerabilities.
- Document Actions: Record every diagnostic command, configuration change, and rollback step in a shared incident war room.
- Isolate Variables: Make only one deliberate change at a time and evaluate its specific effect before moving to the next hypothesis.
- Maintain Reversibility: Ensure that every test configuration can be reverted quickly if it fails to resolve the issue.
Enforcing structured incident response protocols guarantees that troubleshooting proceeds methodically and safely. Engineers should maintain a real-time incident timeline detailing who made which modification and at what exact timestamp. This controlled process prevents conflicting operational actions, simplifies post-mortem investigations, and ensures the infrastructure remains stable and secure.
How to Become an Operations Expert — Career Roadmap
Deepening Core Linux and Networking Fundamentals
Building true expertise in cloud operations begins with a thorough mastery of Linux operating system internals and low-level networking. You must understand how the Linux kernel manages system calls, schedules CPU threads, handles memory paging, and routes network packets. Learn how to use core diagnostic utilities like strace, perf, lsof, and tcpdump to inspect system behavior directly at the kernel boundary. This low-level competence enables you to solve intricate issues that abstract management interfaces fail to explain.
- Kernel Telemetry: Study eBPF to trace kernel-level events, system calls, and network socket activity with minimal overhead.
- Network Analysis: Master protocol analysis using Wireshark to diagnose packet drops, window sizing issues, and TLS handshake failures.
- Storage Systems: Understand filesystem journaling, block storage caching, and disk scheduling algorithms to diagnose I/O performance bottlenecks.
+-------------------------------------------------------------------+
|                  LOW-LEVEL DIAGNOSTIC TOOLKIT                     |
+-------------------------------------------------------------------+
|  System Calls  | strace, lsof, fuser                              |
|  Performance   | perf, vmstat, iostat, mpstat, top / htop         |
|  Networking    | tcpdump, ss, ip, dig, mtr, traceroute            |
|  Kernel eBPF   | bpftrace, BCC tools                              |
+-------------------------------------------------------------------+
Additionally, cultivate a detailed understanding of the complete TCP/IP stack, BGP routing, and modern transport protocols like QUIC. When high-level cloud abstractions fail, having the ability to analyze a raw packet capture gives you a distinct professional edge. Investing in these foundational skills transforms you from a superficial dashboard operator into a genuine infrastructure diagnostics authority.
Mastering Automated Telemetry and Incident Response Workflows
To advance further, you must master modern observability frameworks and automated incident response systems. Gain hands-on proficiency with open-source telemetry standards like OpenTelemetry to instrument microservices with custom metrics and distributed tracing. Learn to build advanced Grafana dashboards that present complex telemetry intuitively, allowing responders to identify anomalies at a glance. Furthermore, explore automated incident orchestration platforms to streamline alert routing and auto-remediation.
[ Application / Cloud Infrastructure ]
                  |
                  v
[ OpenTelemetry Collectors & Exporters ]
                  |
                  +---> [ Prometheus / Metrics Engine ]
                  +---> [ OpenSearch / Log Ingestion  ]
                  +---> [ Jaeger / Distributed Tracing]
                  |
                  v
[ Centralized Grafana Observability Dashboard ]
Develop skills in writing custom Prometheus recording rules and advanced alert expressions that filter out transient metric blips. Learn to build automated remediation scripts that execute safely within container orchestrators to restore failing pods automatically. By mastering these automated workflows, you scale your diagnostic capabilities across thousands of distributed servers effortlessly.
Developing Chaos Engineering and Resilience Testing Practices
The final milestone in becoming an operations expert is shifting from purely reactive troubleshooting to proactive resilience engineering. You should learn to design and execute controlled chaos experiments using frameworks like Chaos Mesh or LitmusChaos. By intentionally injecting latency, terminating primary nodes, and simulating network partitions in staging environments, you uncover hidden architectural weaknesses before they cause real-world outages.
- Hypothesis Formation: Define baseline performance metrics and predict how the system should behave under injected stress.
- Controlled Injection: Simulate node crashes, packet corruption, and database failovers in a strictly bounded blast radius.
- Verification & Hardening: Verify whether automated failovers occurred smoothly, refine alert rules, and patch discovered vulnerabilities.
This proactive discipline helps your team validate automated failover mechanisms, verify alert configurations, and test runbooks under realistic failure conditions. Over time, practicing chaos engineering builds profound confidence in your infrastructure’s resilience. As an operations expert, you will guide your organization from simply reacting to disasters to building self-healing, highly dependable cloud platforms.
FAQ Section
- What is the first step an engineer should take when an unexpected cloud outage occurs?The first step is always to verify the operational blast radius and establish clear incident communication channels. Responders should check customer-facing error rates and high-level health dashboards to determine which services are affected. Avoid making hasty configuration changes; instead, secure telemetry artifacts and assemble the incident team in a shared channel to coordinate actions methodically.
- Why do cloud databases suddenly experience performance degradation despite low CPU usage?Cloud databases often degrade due to storage I/O bottlenecks or lock contention rather than CPU exhaustion. If a storage volume depletes its burst IOPS credits, disk read/write throughput throttles down severely, forcing database queries to wait. Analyzing disk queue length, IOPS utilization, and active database lock tables quickly clarifies the root cause.
- How does distributed tracing differ from traditional application logging?Traditional logging records isolated, standalone events on a single server, making it difficult to follow requests across multiple microservices. In contrast, distributed tracing attaches a unique correlation ID to a request as it enters the system, tracking its entire path across every internal API call and database query. This provides end-to-end visibility into where latency is introduced.
- What is the most reliable way to prevent configuration drift across cloud environments?The most reliable approach is to enforce immutable infrastructure workflows using Infrastructure as Code tools like Terraform. Prohibit all manual modifications via cloud web consoles and route every environment update through automated CI/CD deployment pipelines. Implementing automated drift detection tools ensures that any unauthorized modifications are caught and reconciled immediately.
- How can engineering teams distinguish between application software bugs and underlying cloud provider outages?Teams should cross-reference internal application telemetry against their cloud provider’s official status dashboards and regional network health metrics. If multiple independent services within the same availability zone experience simultaneous connectivity drops, an infrastructure-level provider issue is likely. Utilizing multi-region observability and synthetic probes helps isolate external cloud disruptions conclusively.
Final Summary
Troubleshooting complex cloud environments effectively requires a structured, disciplined methodology supported by comprehensive observability tooling. Engineers must move away from reactive, speculative guesswork and instead follow evidence-based diagnostic procedures centered on metrics, logs, and distributed traces. By avoiding common pitfalls like alert fatigue, configuration drift, and superficial fixes, teams can resolve operational incidents with speed and precision. Ultimately, combining strong foundational networking skills, automated incident workflows, and a blameless learning culture builds resilient cloud architectures that deliver exceptional reliability.
