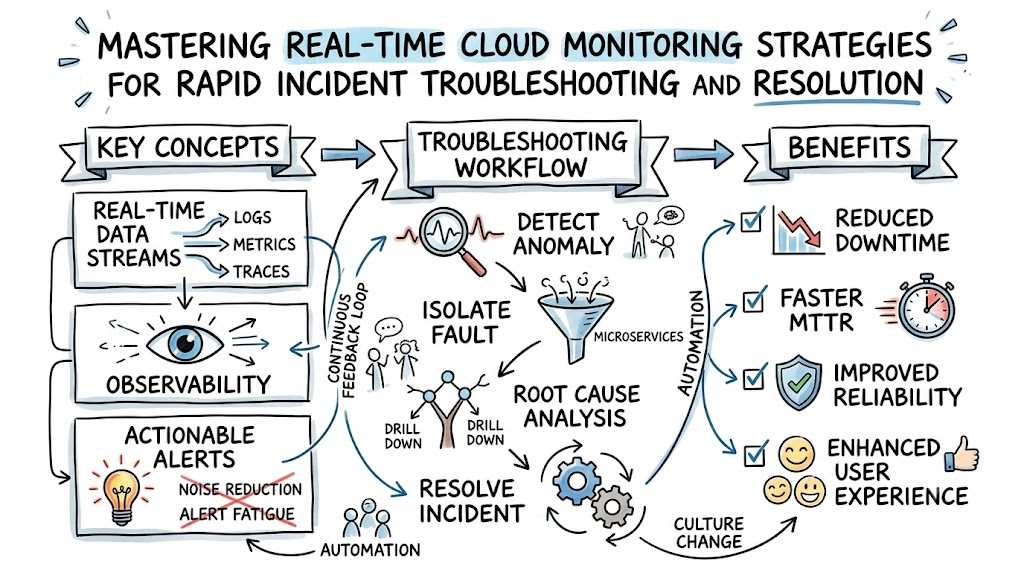
Distributed cloud computing requires continuous visibility across ephemeral compute instances, containerized workloads, and microservice meshes. Without immediate operational intelligence, small memory leaks and configuration errors rapidly expand into catastrophic system outages. Modern enterprises face severe consequences when unexpected downtime compromises service availability and damages customer trust. Therefore, engineering teams prioritize instant observability to inspect internal states and remediate anomalies before users experience degradation.
Establishing an automated observation pipeline enables engineering teams to isolate root causes with surgical precision. To build resilient and self-healing environments, forward-looking engineering teams collaborate with specialized partners like Cloudopsnow to design unified telemetry platforms. Consequently, proactive live surveillance transforms incident management from frantic firefighting into structured, continuous optimization. This detailed technical guide explores how continuous telemetry drives rapid diagnosis, operational stability, and architectural resilience across modern cloud ecosystems.
Gaining Instant Visibility Across Distributed Cloud Environments
Distributed cloud architectures scatter application components across multiple regions, availability zones, and container clusters. Because these modular services run independently, identifying performance bottlenecks requires instantaneous visibility across the entire compute fabric. Real-time telemetry continuously aggregates system outputs, illuminating inter-service dependencies and latent network strain.
Moreover, dynamic container orchestration platforms scale and destroy workloads in seconds. As a consequence, traditional scheduled polling systems fail to capture transient execution spikes or sudden container crashes. Continuous monitoring ingests live telemetry streams, providing an exact and live inventory of every active resource. This constant operational awareness ensures that engineers evaluate accurate performance patterns rather than outdated system snapshots.
Accelerating Root Cause Analysis and Fault Isolation
When an outage strikes, operational teams must quickly pinpoint the exact failure mechanism to restore system operations. Traditional post-incident log parsing wastes valuable engineering time and delays critical remediation actions. In contrast, live telemetry correlates system events instantly, revealing whether an issue stems from database lock contention, memory exhaustion, or network degradation.
Furthermore, real-time diagnostic platforms display distributed trace paths that trace a single user request across dozens of microservices. By highlighting slow database calls and broken downstream services, these platforms remove diagnostic guesswork. Consequently, developers can immediately quarantine unhealthy application components and deploy targeted patches without disrupting the broader user ecosystem.
Mitigating Unplanned Downtime and Business Disruption
System failures cause immediate revenue loss and erode hard-earned customer trust across digital channels. However, catastrophic outages rarely occur without warning; they usually follow subtle warning indicators like minor memory leaks or rising packet drop rates. Live tracking tools actively detect these early degradation signatures, allowing operations teams to intervene before services degrade.
Additionally, streaming telemetry enables automated recovery routines that neutralize threats without manual human involvement. For instance, when memory saturation crosses predefined safety thresholds, automated health probes gracefully restart the affected container or scale compute capacity. By preempting system failures before they impact end users, modern platforms uphold strict availability standards and maintain reliable business operations.
Bridging Telemetry Guts With Proactive Automated Alerting
Collecting massive volumes of system data delivers little value if engineers drown in persistent noise and false alerts. When monitoring systems fire indiscriminately, alert fatigue sets in, causing teams to ignore critical operational warnings. Modern observability pipelines solve this by applying algorithmic noise reduction, clustering related alerts into actionable incident tickets.
Consequently, notifications accurately reflect actual service degradation rather than harmless background spikes. By connecting clean telemetry streams to automated incident response workflows, the system immediately routes relevant context to on-call engineers. This streamlined notification cycle shortens initial triage time and accelerates incident resolution.
Key Operational Concepts You Must Know
The Triad of Observability: Metrics, Logs, and Traces
Modern cloud observability relies on three core pillars: metrics, logs, and distributed traces. Metrics provide lightweight, numeric aggregations that reveal overall system health and capacity limits over time. Logs deliver detailed, time-stamped textual descriptions of specific code events, application states, and internal errors. Distributed traces document the complete path of a request as it traverses modular infrastructure layers.
       +---------------------------------------------+
       |             Unified Observability           |
       +---------------------------------------------+
             /               |               \
            v                v                v
     +-------------+  +-------------+  +-------------+
     |   Metrics   |  |    Logs     |  |   Traces    |
     | Aggregated  |  | Time-Stamped|  | End-to-End  |
     |  Counters   |  | Event Data  |  | Latency Path|
     +-------------+  +-------------+  +-------------+
When isolated, each pillar offers only a partial view of system performance. However, binding these data types together provides complete operational transparency. For example, an alert identifies a high latency metric, distributed tracing isolates the struggling microservice, and structured logs reveal the exact exception. Correlating these three pillars enables fast, confident, and accurate system troubleshooting.
Defining Actionable Service Level Objectives (SLOs)
Operational teams must define clear operational targets that reflect the actual user experience. Service Level Indicators (SLIs) evaluate specific performance metrics, such as endpoint latency or successful request percentages. Concurrently, Service Level Objectives (SLOs) establish the target reliability goals that the infrastructure must maintain.
  +--------------------+       Measures       +--------------------+
  |      SLI Data      | -------------------> |    Real Latency    |
  +--------------------+                      +--------------------+
            |
            v  Compares Against
  +--------------------+       Protects       +--------------------+
  |      Target SLO    | -------------------> |   Error Budget     |
  +--------------------+                      +--------------------+
Establishing realistic SLOs protects engineering teams from setting arbitrary uptime metrics that waste operational bandwidth. Furthermore, managing services against an explicit error budget balances rapid feature delivery with architectural stability. When error budgets deplete, teams pause risky code updates to focus exclusively on stability improvements and system health.
Push vs. Pull Telemetry Collection Architectures
Telemetry ingestion generally uses two primary data transport patterns: push-based or pull-based collection. In a pull architecture, a central scraper queries operational endpoints at regular, predictable intervals. This approach simplifies client designs and centralizes scraping schedules across large instance fleets.
Conversely, a push model requires workloads to stream metrics directly to centralized ingestion gateways. This design works exceptionally well for serverless compute and short-lived batch jobs that terminate before a scraper runs. Selecting the right collection model ensures complete observability coverage across diverse infrastructure environments.
Real-Time Event Correlation and Anomaly Detection
High-throughput systems generate millions of discrete operational events every minute. Manual inspection of such vast data volumes during an incident is practically impossible. Modern observability solutions therefore incorporate dynamic anomaly detection to establish healthy behavioral baselines.
[Incoming Telemetry Stream] ---> [Algorithmic Correlation] ---> [Suppressed Noise]
                                            |
                                            +---> [Actionable Unified Incident Alert]
When system metrics deviate from historical seasonal norms, correlation engines group related anomalies together. For example, a database crash often triggers cascading timeouts, HTTP 500 errors, and queue backups. Rather than dispatching dozens of disconnected alerts, the system groups them into a single incident, pointing directly to the root database failure.
Platform Implementation vs. Culture — What’s the Real Difference?
| Engineering Domain | Platform Implementation Focus | Cultural & Mindset Focus |
|---|---|---|
| Telemetry Ingestion | Deploying agents, configuring OpenTelemetry collectors, and provisioning storage. | Prioritizing actionable telemetry during software design and respecting observability standards. |
| Alert Management | Setting metric thresholds, defining pager escalation, and filtering raw noise. | Respecting on-call engineers, preventing burnout, and eliminating duplicate alerts. |
| Incident Response | Running rollback pipelines, spinning up replicas, and rerouting network traffic. | Conducting blameless post-mortems, sharing lessons learned, and continuously improving. |
| Performance Budgets | Enforcing rate limits, CPU throttling, and automated memory management. | Treating system reliability as a critical feature and balancing speed with stability. |
Technical Execution vs. Organizational Alignment
Platform implementation covers the software stacks, agents, and automation scripts that collect and process telemetry data. Engineers deploy collector daemons, establish secure network tunnels, and create centralized operational dashboards. While these tools form the backbone of your monitoring setup, infrastructure alone cannot guarantee operational reliability.
Conversely, an organization’s internal culture defines how engineering teams interpret and act on telemetry insights. A healthy culture prioritizes system reliability, values transparent communication, and encourages cross-team accountability. When leadership champions operational excellence, developers write clean, observable code from day one. Balancing technical capability with organizational buy-in creates a resilient, high-performing operational environment.
Transitioning from Reactive Firefighting to Continuous Observability
Organizations often struggle with operational inefficiencies when engineering teams operate in disconnected silos. Without standardized monitoring practices, teams deploy incompatible tools that obscure inter-service dependencies. This fragmentation turns simple outages into finger-pointing exercises that delay issue resolution.
Reactive Workflow:
[Silent Failure] ----> [Customer Complains] ----> [War Room Chaos] ----> [Tense Hotfix]

Proactive Workflow:
[Telemetry Anomaly] --> [Automated Alert] -----> [Traced Root Cause] ---> [Clean Resolution]
Overcoming this challenge requires embedding observability directly into daily software development processes. Teams should establish uniform logging standards, enforce consistent tagging, and review operational readiness before releasing features. In doing so, organizations shift from chaotic firefighting to proactive system management, resolving issues well before they impact production users.
Real-World Use Cases of Modern Operations
Fintech Payment Processing Gateways
Financial payment gateways process millions of transactions per second, where even brief outages can trigger severe revenue losses and regulatory fines. These platforms demand real-time telemetry to track authorization rates, settlement pipelines, and tokenization services continuously.
[Cardholder Terminal] ---> [API Gateway] ---> [Payment Engine] ---> [Banking Core API]
                                |                     |                     |
                      (Live Latency Gauge)    (Trace Collector)    (Error Rate Counter)
Operations teams deploy distributed tracing to inspect transaction handshakes across core banking networks. When a payment gateway experiences delays, monitoring systems isolate the failing clearing network in real time. The platform then dynamically reroutes payment requests to backup partners, preventing failed transactions and protecting revenue.
High-Volume Streaming Media Networks
Streaming media platforms distribute high-definition video content to millions of concurrent viewers across various network topologies. In this environment, packet loss and buffering directly degrade the viewer experience. Operations teams track content delivery performance by monitoring edge caches, origin server loads, and video segment delivery times.
- Buffer Ratio Tracking: Continuously measures client-side playback buffers to detect buffering events before users disconnect.
- Edge Cache Monitoring: Tracks cache hit-and-miss ratios across edge locations to prevent traffic surges on origin clusters.
- Dynamic Bitrate Tuning: Automatically adjusts video resolutions based on regional network constraints, preserving uninterrupted playback.
When an internet service provider experiences localized transit degradation, real-time telemetry flags the drop in throughput immediately. System traffic controllers automatically redirect viewer requests to alternative content delivery networks. This proactive rerouting keeps video streams smooth and prevents widespread service interruptions.
Large-Scale Multi-Tenant SaaS Environments
Multi-tenant enterprise platforms serve thousands of corporate clients through shared cloud resources and microservice fabrics. A single tenant running unoptimized database queries can monopolize shared resources, causing a “noisy neighbor” problem that slows down other users.
[Tenant A: High Traffic] ---\
                             +---> [Shared App Cluster] ---> [Noisy Neighbor Detected]
[Tenant B: Normal Load] ----/               |
                                            v
                             [Automated Throttling Applied]
Real-time telemetry systems track resource usage across tenants, monitoring execution duration, memory allocation, and database lock times. When an abusive workload spikes, the system flags the anomalous consumption immediately. Automated rate-limiting policies kick in to isolate the noisy tenant, safeguarding baseline performance for all other users.
Common Mistakes in Operations Engineering
Setting Arbitrary Alert Thresholds and Generating Noise
A widespread mistake in operations engineering is establishing rigid, arbitrary alerting thresholds on raw metrics like CPU utilization. Systems often run at high CPU capacity while serving user traffic efficiently and without errors. Alerting on harmless resource spikes creates persistent noise that exhausts on-call teams.
Bad Alerting:    [CPU Spikes to 85%] ------------> (Pagers Wake Engineers At 3 AM)
Effective Alert: [SLO Breached: Errors > 1%] -----> (Actionable Alert Dispatched To Team)
Instead of monitoring raw resource consumption, teams should configure alerts based on customer impact and service level commitments. Track application error rates, response latencies, and failed user transactions instead. Tying alerts directly to user experience eliminates false alarms and ensures engineers respond only to genuine operational emergencies.
Siloing Monitoring Data Across Disconnected Systems
Another common engineering trap is using disconnected monitoring tools across separate infrastructure layers. Infrastructure teams monitor physical servers, software teams track application logs, and database administrators review queries independently. This fragmented setup prevents teams from seeing the complete operational picture during complex outages.
Siloed Monitoring:   [App Logs Tool]       [Cloud Metrics Tool]       [APM Tracing Tool]
                             \                      |                      /
                              +---------> (Fragmented Incident View) <-----+

Unified Observability: [Logs + Metrics + Traces Linked Via Trace ID] -> (Clear Root Cause)
To resolve this issue, organizations must consolidate telemetry data into a unified, cross-functional observability platform. Linking metrics, logs, and distributed traces through shared trace identifiers gives teams complete visibility into their software ecosystem. This unified approach eliminates cross-team finger-pointing and significantly shortens recovery times.
Instrumenting Without Contextual Metadata and Labels
Collecting high volumes of telemetry data provides little value if records lack critical contextual metadata. Raw error logs that lack tenant identifiers, service names, and deployment versions make root-cause analysis exceptionally difficult. Engineers waste valuable hours searching through undifferentiated log streams to find relevant error details.
- Missing Deployment Versions: Prevents engineers from identifying whether a recent canary deployment introduced a bug.
- Absence of Regional Tags: Makes isolating local network issues from global system outages significantly harder.
- Omitted Tenant Identifiers: Prevents support teams from identifying which specific enterprise customers are affected by an ongoing incident.
Every telemetry record must include standardized metadata attributes like environment names, service identifiers, and commit hashes. Consistent tagging allows teams to slice, dice, and filter data instantly during an outage. Adding rich operational context turns unstructured data into actionable insights for fast, targeted troubleshooting.
How to Become an Operations Expert — Career Roadmap
Mastering Distributed Systems and Telemetry Protocols
To become an elite operations expert, you must first build a deep understanding of distributed systems and telemetry protocols. Study the underlying mechanics of modern protocols like OpenTelemetry, gRPC, and message streaming architectures. Understanding how tracing headers propagate across service boundaries allows you to design scalable observability pipelines that capture rich system data without introducing latency.
- Protocol Architecture: Master OpenTelemetry standards to configure vendor-neutral data collection pipelines.
- Kernel Observability: Learn eBPF technologies to inspect network packet paths and kernel calls with minimal CPU overhead.
- Storage Engines: Understand how time-series databases handle high-write ingestion, compression, and query optimization.
Additionally, study how distributed messaging queues process real-time telemetry streams under heavy load. Knowing how to handle data backpressure, partition data, and set up retention policies helps you maintain monitoring stability when your primary systems experience outages. This low-level technical expertise provides the foundation for building enterprise-grade observability platforms.
Designing Resilient Infrastructure as Code Platforms
Modern operations depend on code-driven automation; therefore, mastering Infrastructure as Code (IaC) tools is essential for career advancement. Learn to manage telemetry pipelines, monitoring agents, and alert rules as version-controlled software assets. Using tools like Terraform ensures your observability infrastructure deploys predictably across every development, staging, and production environment.
+---------------------------+      Applies To      +---------------------------+
| Git Repository: IaC Code  | -------------------> | Automated Cloud Fleet     |
| Rules, Dashboards, Agents |                      | Unified Telemetry Active  |
+---------------------------+                      +---------------------------+
Furthermore, integrate monitoring validation tests directly into your CI/CD delivery pipelines. Automating dashboard and alert deployments ensures that every new microservice releases with full monitoring coverage from day one. This automated approach prevents blind spots, enforces corporate governance, and frees engineers to focus on higher-value system optimizations.
Cultivating Incident Command and Observability Leadership
Technical skill alone does not make an operations expert; you must also develop strong leadership skills during critical incidents. Learn to serve as an Incident Commander, coordinating team communications, delegating diagnostic tasks, and managing executive updates during outages. Remaining calm and structured under pressure helps cross-functional teams resolve high-priority incidents efficiently.
                +---------------------------------------+
                |          Incident Commander           |
                +---------------------------------------+
                   /                 |                 \
                  v                  v                  v
        [Diagnostic Lead]   [Communications Lead]  [Remediation Lead]
        (Isolates Faults)   (Updates Stakeholders) (Deploys Fixes)
After resolving an outage, lead blameless post-mortem retrospectives that focus on structural, systemic improvements rather than personal fault. Help your team evaluate telemetry blind spots, improve alert accuracy, and automate manual remediation steps. Sharing these lessons across your organization elevates operational standards and fosters a culture of continuous improvement.
FAQ Section
- What is the difference between real-time cloud monitoring and cloud observability?Real-time cloud monitoring tracks predefined metrics and alerts teams when system thresholds cross acceptable limits. In contrast, cloud observability uses external telemetry data—metrics, logs, and distributed traces—to infer the internal state of a system. Monitoring alerts you that a problem exists, whereas observability helps you understand why the failure occurred.
- How does distributed tracing help pinpoint performance issues across microservices?Distributed tracing injects unique metadata tags into request headers as transactions enter a software ecosystem. As the request travels across internal microservices, each component records its execution duration and status. This generates an end-to-end visual timeline that highlights the exact database query, external API call, or service causing delays.
- Why do operations teams prioritize Service Level Objectives over raw resource alerts?Raw resource metrics, such as a CPU utilization spike, often fail to indicate whether users are experiencing poor performance. Service Level Objectives focus on metrics that directly impact end users, such as error rates and request latencies. Prioritizing SLOs prevents alert fatigue and ensures teams respond to incidents that actually threaten customer satisfaction.
- How do automated self-healing mechanisms use live telemetry data?Automated self-healing systems consume real-time telemetry streams to execute predefined recovery scripts without manual human intervention. For instance, when health check failures or memory usage cross safe thresholds, the system can automatically restart containers, provision additional instances, or isolate failing nodes. This automated response resolves transient issues before users notice an outage.
- Can collecting high volumes of telemetry data degrade application performance?Yes, excessive telemetry generation can consume significant CPU cycles, memory, and network bandwidth. If logging agents write synchronous entries to disk or capture high-volume traces without sampling, the monitoring process can slow down core application performance. Teams should implement smart sampling, asynchronous log processing, and lightweight protocols to maintain deep observability without impacting system speed.
Final Summary
Achieving operational excellence in distributed cloud environments requires moving away from fragmented, reactive monitoring toward unified, real-time observability. By collecting and correlating metrics, logs, and distributed traces, engineering teams can quickly uncover root causes and maintain system reliability. Embracing proactive incident response and eliminating alert noise protects systems from prolonged downtime while safeguarding customer trust. Ultimately, combining robust telemetry platforms with a blameless, continuous-learning engineering culture creates scalable, resilient systems that thrive under heavy production demands.

