The cloud is a giant network of computers. These computers live in big rooms called data centers. Companies use them to run games, websites, and apps. When you open an app on your phone, you talk to the cloud. You expect the app to open fast. But computers can slow down when too many people use them at once.
Companies need to keep their apps running fast and smooth every day. Teams use special rules and tools to manage these cloud systems. Experts call this daily work CloudOps, which means cloud operations. You can learn how to build great systems with help from Cloudopsnow today. They help teams watch their systems and fix delays fast.
Good teams do not wait for things to break. Instead, they check the health of their computers every second. This careful watch is called cloud performance monitoring. It acts like a fitness tracker for computer networks.
What Is Cloud Performance Monitoring?
Cloud performance monitoring means watching cloud computers to make sure they work well. It checks how fast servers answer questions. A server is just a strong computer that serves files to users. Monitoring tools collect clues from these servers all day long.
These tools look at many parts of the system at the same time. They test network wires, storage drives, and software code. Also, they send alerts when a machine gets too hot or too full.
Think of it like a doctor giving a checkup. The doctor checks your pulse and temperature. Monitoring tools check the pulse of cloud servers in the exact same way. If a server feels sick, the team knows right away.
+-------------------------------------------------------------+
|               Cloud Performance Monitoring                  |
+-------------------------------------------------------------+
         |                        |                        |
         v                        v                        v
  [Collect Data]           [Spot Slowdowns]          [Send Alerts]
  Tracks CPU, RAM,         Finds stuck files         Tells engineers
  and network speed        and long delays           to fix bugs fast
Why Fast Speed Matters So Much
Nobody likes to wait for a slow website. If an online store takes ten seconds to load, shoppers leave. They will go buy their toys or clothes somewhere else. Because of this, slow speeds cost businesses real money.
Fast apps make people happy. When a video game loads quickly, players have more fun. They keep playing and tell their friends about it. So, speed is not just a nice feature. Speed is the heartbeat of every online business.
Cloud monitoring shows teams where delays hide. Maybe a photo file is too big to load. Or maybe a database takes too long to find an address. Once teams spot the delay, they can make it faster.
Key Numbers Teams Must Watch
Computers create numbers that show how hard they work. Engineers call these numbers metrics. You can think of metrics as grades on a school report card.
The first big number is CPU usage. The CPU is the main brain of any computer. If the brain works at one hundred percent for too long, it gets tired. Then, apps freeze up and stop working.
The next number is memory usage. Memory, or RAM, holds the notes a computer needs right now. When memory fills up, the computer cannot think clearly. Next, it might crash completely.
| Metric Name | What It Measures | Why It Matters |
|---|---|---|
| Uptime | How long a system stays online | Keeps apps ready for users |
| Latency | How long data takes to travel | Stops annoying delays |
| CPU Usage | How hard the computer brain works | Prevents computer freezes |
| Memory | How much temporary room is left | Stops sudden app crashes |
Tracking Latency and Network Delays
Another key number is latency. Latency is the time it takes for data to travel from your phone to a server and back. When latency is high, you press a button and nothing happens for seconds.
Network traffic can cause high latency very quickly. Imagine a highway during rush hour. When too many cars crowd the road, traffic stops. Data packets get stuck in computer traffic in the same way.
Monitoring tools watch this digital highway day and night. They show when a network path gets too crowded. Then, engineers can open a new path. This keeps data moving smoothly without annoying stops.
Client (Your Phone) ------> [ Crowded Network Road ] ------> Cloud Server
                             (High Latency Delay!)

Client (Your Phone) ------> [ Clean Direct Highway ] ------> Cloud Server
                             (Low Latency = Fast!)
Finding Hidden Problems Early
Small computer bugs can grow into giant disasters. A tiny memory leak can slowly eat up all available space. At first, no human notices any change. But after two days, the entire system can shut down.
Cloud monitoring tools spot these slow leaks right away. They notice when memory drops by even one percent every hour. Then, the tool sounds an alarm before the server crashes.
This early warning saves teams from major headaches. Engineers can patch the bug during normal work hours. Users never see an error screen because the team fixed it early.
Stopping Total System Outages
A complete system crash is called downtime. Downtime means nobody can use the app at all. Banks cannot send money during downtime. Hospitals cannot read patient records during downtime.
Every minute of downtime costs companies thousands of dollars. It also hurts their reputation. Customers lose trust when an app fails often.
Monitoring helps companies achieve high uptime. Uptime means the system stays open and healthy. Most teams aim for ninety-nine point nine percent uptime. Monitoring tools help teams reach that high goal every single month.
Saving Money on Cloud Bills
Cloud servers cost money to rent. Companies pay their cloud provider for every minute a machine runs. If you rent ten huge servers and only use one, you waste money.
Monitoring shows exactly how much power you actually use. It points out empty servers that sit idle all night. Then, teams can turn off those extra machines safely.
Also, monitoring tools help set up auto-scaling. Auto-scaling adds new servers when traffic rises. Next, it removes those servers when traffic drops. This smart habit cuts cloud bills drastically.
- Turn off sleepy servers when nobody uses them at night.
- Shrink oversized machines that only do light work.
- Delete old storage disks that hold forgotten files.
- Buy only the cloud power your apps need right now.
High Traffic Time  ---> Auto-scaling adds 4 extra servers.
Low Traffic Night  ---> Auto-scaling removes 4 extra servers to save cash.
Boosting Application Security
Cloud monitoring does not just check for speed. It also helps protect systems from bad hackers. Hackers often try to break into servers by guessing passwords thousands of times.
This attack creates a sudden spike in traffic. A good monitoring tool spots this strange spike instantly. It warns security guards that someone is knocking on the back door.
Next, the system can block the bad internet address automatically. The attack stops before the hacker steals any private files. Monitoring acts like a security guard standing at the front gate.
Making Big Teams Work Better
Modern software teams have many different workers. Developers write the code for new features. Operations engineers run the servers and fix pipes. Managers track budgets and help customers.
Without monitoring, these groups argue when things go slow. Developers blame the slow network. Operations workers blame messy code. This fighting wastes precious time.
Monitoring tools give everyone one single source of truth. Everyone looks at the exact same graphs and numbers. So, teams stop guessing and start solving problems together as friends.
+-------------------------------------------------------------+
|                   One Shared Dashboard                      |
+-------------------------------------------------------------+
         |                                             |
         v                                             v
  [ Developers ]                              [ Operations Staff ]
  See buggy code lines                        See server CPU load
         \                                             /
          \---> Work Together to Fix the Issue <------/
Helping the User Experience
The most important person is the end user. If users get angry, the whole business fails. Monitoring tools can track how real humans experience your app.
These tools record how long each button click takes. They also count how many times an app crashes on a phone. Engineers call this real user monitoring.
When you track real users, you see true performance. You learn if people in another country have slower loading times. Then, you can place a server closer to their homes.
Choosing the Right Tools
Teams need good software to watch their systems. Many tools exist in the market today. Some tools watch server hardware. Other tools trace individual lines of software code.
Great teams pick tools that put all data on one screen. This screen is called a dashboard. A dashboard uses simple charts, clocks, and colors to show system health.
A green light means everything runs great. A yellow light means a server is getting crowded. A red light means an engineer must fix a problem right now.
+-------------------------------------------------------------+
|                 Cloud Health Status Board                   |
+-------------------------------------------------------------+
|  [GREEN] Web Servers: Healthy (Normal Traffic)              |
|  [GREEN] Databases: Fast (Zero Queued Queries)              |
|  [YELLOW] Storage Disks: 82% Full (Needs Clean Up Soon)     |
|  [RED] Payment Gateway: Slow Response (Check Now!)          |
+-------------------------------------------------------------+
Setting Up Smart Alerts
Monitoring tools can send text messages or emails when problems start. But you must set up these alerts carefully. If a tool sends fifty alerts an hour, engineers get tired.
This problem is called alert fatigue. When too many alerts go off, people start ignoring them. Then, they might miss a real emergency.
Teams should only send loud alerts for critical problems. If a non-urgent disk is getting full, send a quiet daily note. But if the whole website goes down, wake up the on-call engineer immediately.
Best Habits for CloudOps Teams
Good monitoring requires healthy daily habits. First, teams must test their monitoring tools every week. You should make sure your alarms actually ring when a fake test failure happens.
Second, teams must keep their dashboards clean and simple. Do not clutter the screen with useless data. Show only the numbers that help people make smart choices.
Finally, write clear playbooks for every alarm. A playbook is a list of steps to fix a specific problem. When an alarm rings at night, the engineer follows the playbook easily.
- Write clear instructions for every alarm so anyone can help.
- Test your alarms regularly to ensure they work properly.
- Clean up messy dashboards so teams spot facts quickly.
- Review weekly trends to find slow machines before they break.
Fixing Common Monitoring Mistakes
Many teams make easy mistakes when they start monitoring. One big mistake is collecting too much junk data. Storing millions of useless numbers costs lots of money.
Only save the metrics that actually matter to your users. Delete old, useless logs after thirty days to save disk space. This keeps your system neat and lowers your monthly bill.
Another mistake is forgetting to watch third-party services. If your app uses an outside map or payment tool, watch that tool too. If that outside tool breaks, your app might break as well.
Your App -----> [ Outside Payment Tool ] -----> Bank
                 (If this breaks, your app stops!)
                 *Always monitor outside tools too!*
How to Grow Your Monitoring System
As your business grows, your cloud system gets bigger. You will add more servers, databases, and microservices. A microservice is a small program that does one single job well.
Your monitoring setup must grow alongside your cloud. You cannot add new servers by hand every day. Instead, use code to set up monitoring automatically.
When an auto-scaling tool starts a new server, it should install monitoring tools instantly. That way, no server ever runs in the dark. Every part of your cloud stays visible from day one.
The Power of Logs and Traces
Metrics tell you that something is wrong. For example, a metric shows that CPU usage is at ninety-nine percent. But metrics do not tell you why the CPU is high.
That is why you need logs and traces. Logs are diary entries written by computers. They record events like “user logged in” or “file could not open.”
Traces follow a single request as it jumps across ten different computers. A trace shows the exact step that took too long. When you combine metrics, logs, and traces, you solve bugs in minutes.
[ Metric Alert ]  ---> Shows: "Server is too slow!"
        |
        v
[ System Log ]    ---> Reads: "Database error on line 42."
        |
        v
[ Network Trace ] ---> Shows: "Query took 6 seconds inside user search."
        |
        v
[ Instant Fix ]   ---> Engineer fixes line 42 in minutes!
Building a Strong Learning Culture
Tools alone cannot fix a broken system. You need a team that loves learning and sharing facts. When a system goes down, do not blame people.
Instead, hold a blameless post-mortem meeting. A post-mortem is a talk where the team finds out why something broke. The team asks how to stop that problem from ever happening again.
Then, they create a new monitoring check for that bug. This makes the whole system stronger every single month. Good teams treat mistakes as chances to grow smarter.
Keeping Your Cloud Healthy Every Day
Cloud computing helps companies build amazing things for the world. But complex cloud systems need constant care and attention. Without eyes on your systems, small bugs will ruin the user experience.
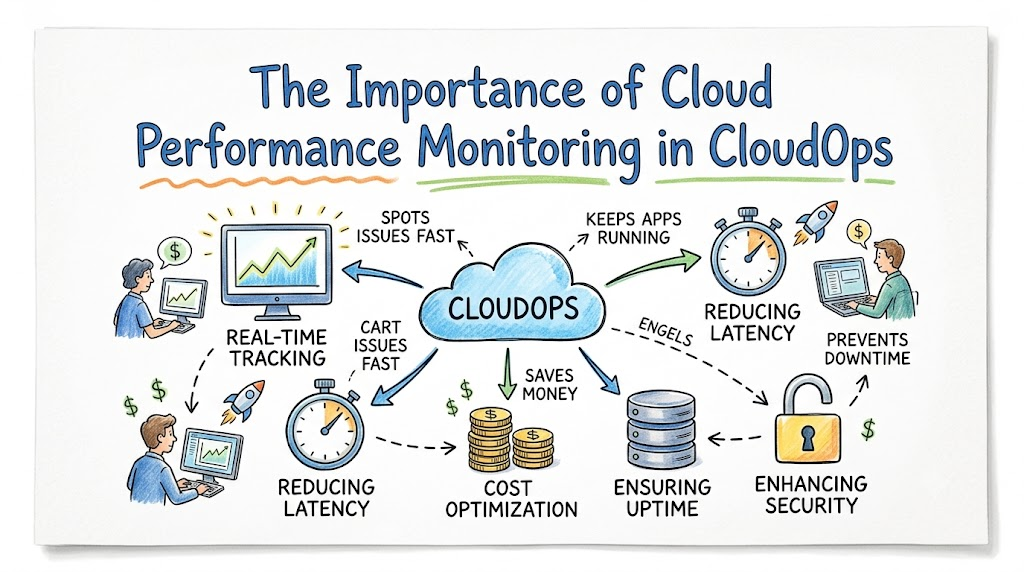
Cloud performance monitoring gives you the eyes you need. It catches memory leaks, stops long delays, and prevents expensive outages. It also protects customer data and lowers your monthly cloud bills.
When you invest in smart monitoring, your whole business thrives. Your apps stay fast, your engineers stay calm, and your users stay happy. Make performance monitoring the foundation of your daily CloudOps strategy today.

