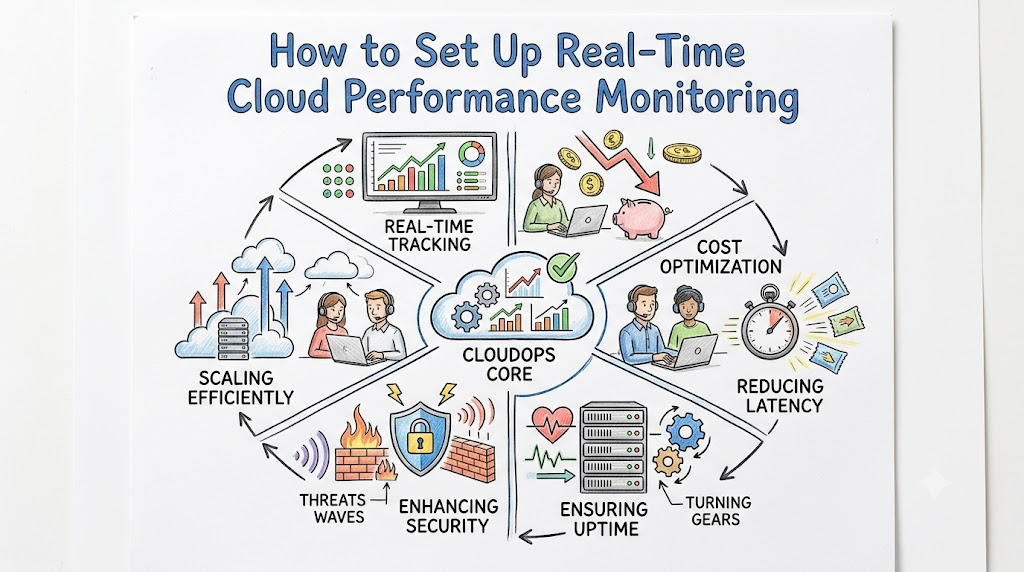
The cloud is a huge web of fast computers. Companies use these computers to run websites, video games, and phone apps. When you tap a button on your screen, data travels to a cloud server. You expect the screen to change right away. But computers can slow down when millions of people join at once.
Teams need to keep their apps running fast every single day. If servers freeze, people get mad and leave. To stop this, teams set up real-time monitoring tools. You can build fast, safe cloud systems with help from Cloudopsnow today. They help teams watch their machines and fix delays fast.
Real-time monitoring means watching your computers every second. It works like a live scoreboard for your digital tools. Let us explore how you can set up this system step by step.
Understanding Real-Time Monitoring
Real-time monitoring checks your cloud systems without any delay. Older tools only checked computers once every hour. That slow pace let small bugs turn into big crashes. Real-time tools stream data live so you see issues instantly.
A cloud server is just a strong computer without a screen. It lives in a warehouse with thousands of other computers. These servers run apps, hold photos, and answer questions. Monitoring tools read the pulse of every single server.
These tools gather clues called metrics. A metric is a simple number that shows computer health. By reading these numbers, teams spot trouble before users ever notice.
+-------------------------------------------------------------+
|                  Real-Time Data Pipeline                    |
+-------------------------------------------------------------+
       |                           |                          |
       v                           v                          v
 [Cloud Servers]            [Metric Stream]            [Live Screen]
 Sends speed data           Moves data fast            Shows charts
 every single second        without any delay          to engineers
Step 1: Pick What You Need to Watch
You cannot fix what you do not measure. But you also cannot watch everything at once. Watching too many things will only confuse your team. So, start by picking your most important targets.
First, track your web apps and games. These programs talk directly to your users. If they run slow, users stop using your service.
Next, watch your databases. A database is an electronic filing cabinet that stores user information. When filing cabinets get messy, apps slow down. Keeping databases fast keeps the whole system happy.
- Watch your web apps so pages load fast.
- Track your databases to keep file searches quick.
- Check your network paths to stop traffic jams.
- Monitor your storage disks so they do not fill up.
Step 2: Choose Your Key Numbers
Computers produce thousands of numbers every minute. You only need a few key metrics to stay safe. Engineers call the most important ones the golden signals.
The first key number is latency. Latency means the time data takes to travel back and forth. Low latency means your app feels super fast. High latency makes your app feel sticky and slow.
The second number is traffic. Traffic counts how many people use your app right now. The third number is errors. Errors count how many times your app fails or breaks.
| Metric Name | What It Checks | What You Want |
|---|---|---|
| Latency | Travel delay of data | Very low numbers |
| Traffic | Number of active users | Steady, smooth lines |
| Errors | Broken requests or bugs | Near zero at all times |
| Saturation | How full the computer is | Under eighty percent |
Understanding Computer Saturation
Saturation measures how full your computer resources are. Think of a backpack packed with heavy school books. If you stuff too many books inside, the zipper breaks.
A computer has two main parts that get full: the CPU and RAM. The CPU is the brain that does math problems. RAM is the short-term memory that holds open files.
If CPU usage stays at ninety-nine percent, the computer freezes. Monitoring tools track saturation so you can add more computers early. This keeps your machines running cool and fast.
Low Saturation (Healthy):   [====                ] 20% Used
High Saturation (Danger):   [====================] 100% Full!
Step 3: Pick the Right Monitoring Tools
You need special software tools to collect your numbers. Good tools collect data fast without slowing down your apps. Many great options exist for cloud teams today.
Some tools watch server hardware and computer chips. Other tools trace software code to find broken lines. You should pick tools that work well together.
Also, choose tools that offer one clear main screen. Engineers call this screen a dashboard. A dashboard puts all your charts and clocks in one place.
Step 4: Install Lightweight Agent Programs
To collect numbers, you must install small programs on your servers. Engineers call these helper programs agents. An agent is like a tiny spy that watches the computer work.
The agent reads how much memory the computer uses. It checks how fast the disk spins. Then, it sends that data to your central dashboard.
Because agents run all day, they must stay very light. A good agent uses less than one percent of your computer power. It works quietly in the background without getting in the way.
+-------------------------------------------------------------+
|                        Cloud Server                         |
|                                                             |
|   [ Your App Code ]                [ Monitoring Agent ]     |
|   Does the main work               Quietly reads speed      |
|           |                                 |               |
+-----------|---------------------------------|---------------+
            v                                 v
      Happy Users                    Central Dashboard
Step 5: Build Clear Visual Dashboards
Raw numbers on a page are very hard to read. A wall of digits will make your eyes hurt. Dashboards turn those boring numbers into colorful charts, graphs, and gauges.
Use bright colors to tell a quick visual story. Green means a server is totally healthy. Yellow means a machine is getting warm. Red means an engineer must fix a problem right now.
Keep your dashboard simple and tidy. Put your most important charts right at the top. Group related items together so anyone can read the board in three seconds.
- Put critical app speed graphs right at the top.
- Use green for good health and red for emergencies.
- Group servers by region so you spot local issues fast.
- Remove old graphs that your team does not read anymore.
Step 6: Connect Logs and Traces
Metrics show you that something went wrong. For example, a metric shows that errors jumped by ten percent. But metrics do not tell you why the error happened.
To find the root cause, you need logs and traces. Logs are written records made by your software. A log reads like a diary entry: “User John could not open file.”
Traces follow a user request as it jumps across different computers. A trace shows the exact step that took too long. When you combine metrics, logs, and traces, you solve bugs in minutes.
[ Metric Spike ]   ---> Alert: "The app is running slow!"
       |
       v
[ System Log ]     ---> Reads: "Database cannot find user table."
       |
       v
[ Code Trace ]     ---> Shows: "Error started in file login.js on line 12."
       |
       v
[ Instant Fix ]    ---> Engineer repairs line 12 right away!
Step 7: Set Up Smart Alert Rules
You cannot stare at a computer screen all day and night. You need to sleep, eat, and do other work. So, you must set up alert rules that wake you up only when things break.
An alert rule is a simple logic test. It says: “If errors rise above five percent, send a text message.” The monitoring tool checks this rule every second.
If the rule triggers, the tool sounds an alarm immediately. It sends a message to an on-call engineer’s phone. Then, the engineer jumps online to fix the system.
Avoiding the Danger of Alert Fatigue
You must set up your alert rules with great care. If your system sends fifty emails an hour, people stop reading them. Engineers call this annoying problem alert fatigue.
When too many false alarms go off, humans ignore the noise. Then, a real emergency happens and nobody notices. That is how huge company outages occur.
Only send loud alarms for critical emergencies that hurt users. If a tiny disk is slowly filling up, send a quiet daily note. Save phone calls and sirens for total website crashes.
Annoying False Alarms:  [Ding!] [Ding!] [Ding!] ---> Engineer ignores phone.
Smart Critical Alarms:  [SIREN: Site Down!]     ---> Engineer fixes bug fast!
Step 8: Set Up Automated Fixes
The best way to fix a problem is to let computers do it. Computers react in milliseconds, while humans take minutes to wake up. Modern monitoring tools can trigger automated actions instantly.
One great automated tool is auto-scaling. If traffic suddenly spikes, your servers can get overwhelmed. The monitoring tool spots this rise in traffic right away.
Next, the tool tells the cloud to turn on three new servers. The new servers share the heavy workload automatically. When the rush ends, the tool turns off the extra machines to save cash.
- Add new servers automatically when web traffic surges.
- Restart stuck software services without human help.
- Reroute network traffic away from broken data centers.
- Shrink your server fleet at night to cut power bills.
Step 9: Test Your Alarms Regularly
Never assume your monitoring setup works without testing it first. Firefighters run practice drills to test their hoses and sirens. Cloud teams must run test drills in the exact same way.
Engineers call this practice chaos engineering. You break a non-critical server on purpose during the day. Then, you watch your dashboard to see what happens.
Did the green light turn red? Did the system send a text message to the right person? If the alarm stays silent, you found a gap in your safety net. Fix the gap before a real disaster strikes.
+-------------------------------------------------------------+
|                 Fire Drill for Cloud Systems                |
+-------------------------------------------------------------+
| 1. Turn off a test server on purpose.                       |
| 2. Check the live dashboard for red warning lights.         |
| 3. Confirm that the on-call engineer gets a text alert.     |
| 4. Verify that auto-scaling replaces the broken server.     |
+-------------------------------------------------------------+
Step 10: Watch Real User Experiences
Server numbers only tell half the story. A server might look totally healthy while users face broken screens. To get the full picture, track real user data.
Special tools run inside the user’s web browser or phone app. They record how long a page takes to paint on the glass. Also, they track broken buttons and failed image downloads.
This data helps you find regional network issues. Maybe users in one city experience slow speeds while everyone else is fast. Once you know this, you can move servers closer to that city.
Step 11: Write Clear Playbooks
When an alarm goes off at three in the morning, people feel sleepy and stressed. Stressed humans make easy mistakes. They might delete the wrong file or turn off the wrong server.
To prevent panic, write clear step-by-step guides called playbooks. A playbook gives exact instructions for every single alarm.
The playbook explains what the alarm means in simple English. Next, it lists three simple commands to fix the problem. Anyone on the team can follow the playbook and resolve the issue quickly.
+-------------------------------------------------------------+
|                Sample Emergency Playbook                    |
+-------------------------------------------------------------+
| Alarm Name: Database Queue Overflow                         |
| Meaning: Too many users are asking for records at once.     |
| Step 1: Check the database dashboard for stuck queries.     |
| Step 2: Clear dead locks using the reset command.           |
| Step 3: Add two read-only database mirrors.                 |
+-------------------------------------------------------------+
Step 12: Review Trends Every Week
Real-time monitoring helps you solve instant emergencies. But it also helps you plan for the future. Look at your metric graphs over days, weeks, and months.
Weekly reviews show you long-term trends. You might notice that your storage disk fills up by two percent every single week. That means the disk will run out of room in one year.
Because you saw the trend early, you can buy bigger disks calmly. You avoid an emergency completely through careful planning. Great teams use monitoring data to stay proactive every day.
Common Setup Mistakes to Avoid
Many teams run into common traps when setting up their monitoring systems. One classic mistake is storing every single metric forever. Storing billions of old data points gets very expensive.
Drop high-detail data after thirty days to save money. Keep summary data for long-term trends and discard the rest. This keeps your monitoring bills low and your databases lean.
Another big mistake is keeping dashboards secret. Give every developer and manager access to the monitoring screen. When everyone sees system health, the whole team works together better.
- Do not store high-detail data forever; clear it after thirty days.
- Never hide dashboards; share them with the entire engineering team.
- Do not set alert limits too tight, or you will create false alarms.
- Never ignore outside tools like credit card payment systems.
Summary of Monitoring Best Practices
Setting up real-time performance monitoring takes time, but it pays off every single day. It keeps your apps fast, protects your company revenue, and keeps users smiling.
Start by picking your golden signals like latency, traffic, and errors. Next, install lightweight agents and build clean, colorful dashboards. Set up smart alerts that wake you up only for real emergencies.
Finally, write clear playbooks and test your system with practice drills. When you watch your cloud systems in real time, you run a reliable, world-class digital business.

