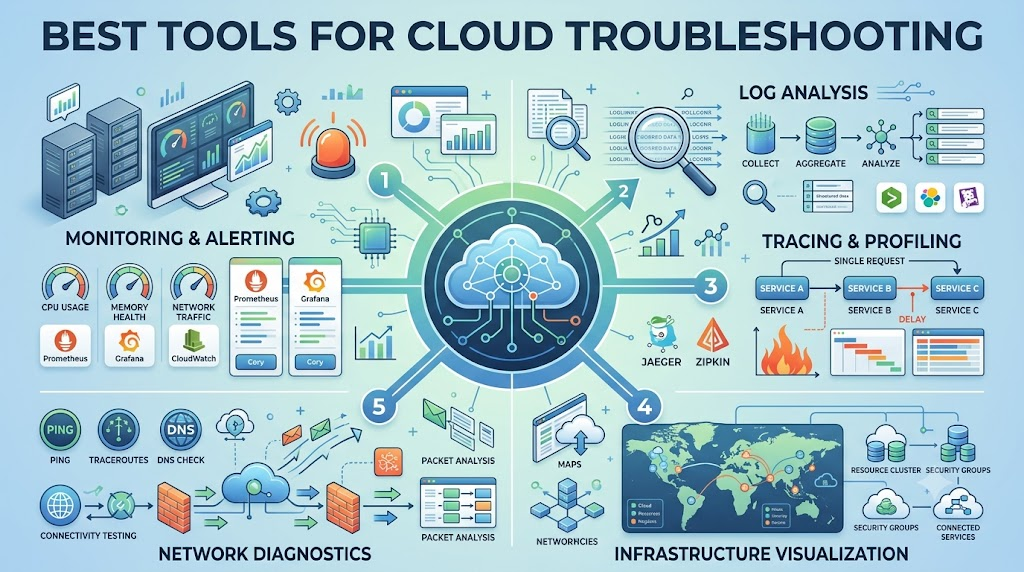
Computers in the cloud can break just like home computers. When cloud programs crash, engineers need special toolkits to locate and fix problems quickly. Helping teams discover these breakdowns is simple with dedicated guidance from Cloudopsnow.
Troubleshooting means playing detective with broken computer systems. Software tools gather clues from every corner of the network. These smart toolkits pinpoint mistakes before normal users experience problems.
What Does Cloud Troubleshooting Actually Mean?
Cloud troubleshooting is the process of finding and fixing issues inside offsite data centers. Sometimes a server runs out of storage space. Other times, a minor software bug stops users from loading their favorite apps.
These problems disrupt normal business routines every day. Engineers rely on diagnostic toolkits to inspect systems and resolve errors rapidly.
How Digital Detectives Find Problems
Troubleshooting relies on three simple clues:
- Metrics: Quick numbers that reveal system health, such as processor usage or memory levels.
- Logs: Plain text diaries written by computers that detail every action taken.
- Traces: Digital breadcrumbs showing the full journey of a user click.
The Top Five Troubleshooting Toolkits
Different software problems require different investigative tools. Here are five popular platforms teams rely on to keep cloud systems healthy:
| Tool Name | Best Superpower | Good For |
|---|---|---|
| Datadog | Features colorful dashboards with hundreds of plug-and-play app connections. | Big cloud setups needing fast visual answers. |
| Grafana Cloud | Excellent open-source tool for building custom metric displays. | Teams that enjoy assembling their own charts. |
| Dynatrace | Uses automated computer brains to spot root system failures. | Huge networks with thousands of microservices. |
| New Relic | Shows total application health from a single web screen. | Busy developers tracking live coding errors. |
| Splunk | Rapidly searches through millions of lines in server log diaries. | Security analysts and large corporate databases. |
Key Operational Concepts You Must Know
To repair broken cloud networks, engineers track key performance indicators:
- Uptime and Downtime: Uptime measures how long a site runs normally, while downtime tracks outages.
- System Latency: The delay between a user clicking a button and the computer responding.
- Error Rates: The tally of failed requests compared to successful visits.
- Saturation: A warning that storage or memory is full and ready to crash.
Platform Implementation vs. Culture — What’s the Real Difference?
Buying shiny software tools is only half the battle. If engineers hide mistakes from each other, even the best diagnostics cannot help.
- The Platform Side: The technical software, dashboard screens, and alert sirens.
- The Culture Side: The team mindset of teamwork, blameless learning, and shared ownership.
Strong teams treat crashes as learning opportunities. They run calm reviews to fix broken tools without pointing fingers at colleagues.
Real-World Use Cases of Modern Operations
Troubleshooting tools safeguard everyday digital services:
- Online Toy Stores: Monitoring alerts engineers before a checkout page crashes during busy sales spikes.
- Mobile Streaming: Quick tracing identifies faulty media servers so video streams stay smooth.
- Online School Apps: Health checks alert teachers immediately when classroom audio feeds disconnect.
Common Mistakes in Operations Engineering
Avoid these common pitfalls when debugging cloud applications:
- Ignoring Minor Alerts: Overlooking tiny error messages until they explode into full system crashes.
- Too Many Alarms: Setting alarms on every metric, creating constant noise that engineers learn to tune out.
- Storing Too Much Data: Saving useless logs wastes money and makes critical clues harder to locate.
- Forgetting the User: Focusing solely on server statistics while ignoring the customer’s real experience.
How to Become an Operations Expert — Career Roadmap
You can master cloud operations with a steady learning plan:
- Step 1: Learn Basic Computing: Practice basic networking rules and learn core Linux terminal commands.
- Step 2: Read System Diaries: Practice finding errors hidden inside mock log files.
- Step 3: Practice with Test Labs: Launch small test servers using automated cloud blueprints.
- Step 4: Build Alert Monitors: Connect free dashboard tools like Grafana to monitor home projects.
FAQ Section
Why do cloud applications crash in the first place?
Applications usually break when too many visitors arrive at once, or when a developer introduces a hidden bug into software code.
What is the fastest way to spot an outage?
Set up automated alerts using tools like Datadog or New Relic to notify your on-call team via chat message or phone call the second errors spike.
Do small companies need expensive monitoring software?
No, small teams can easily start with free, open-source platforms to track basic system health without overspending.
Final Summary
Modern cloud networks are powerful, but they require regular care and maintenance. Specialized diagnostic tools help engineers detect system bugs before customers notice delays. By combining smart monitoring toolkits with transparent teamwork, you can keep cloud applications fast, stable, and resilient.
