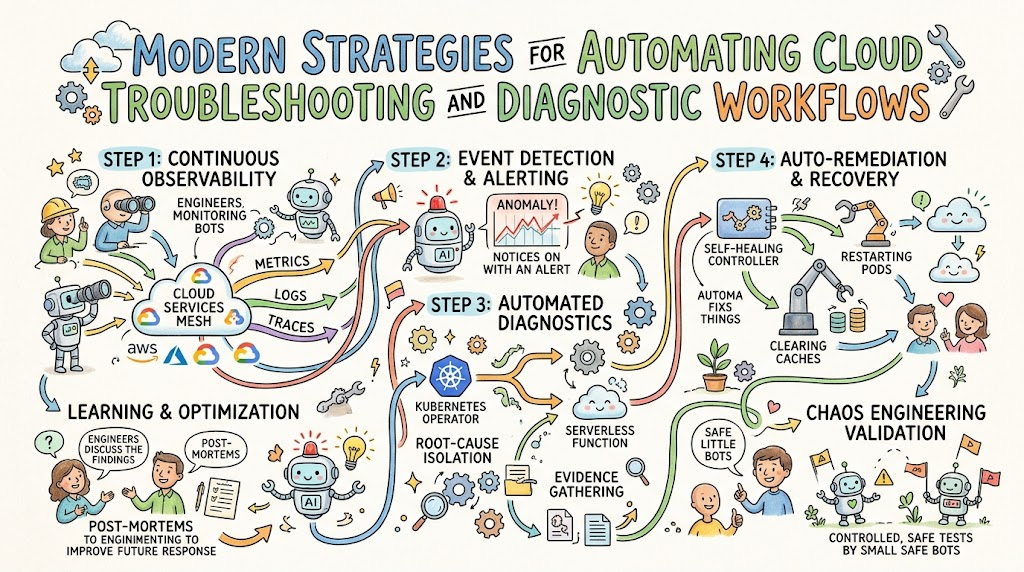
Cloud architectures grow larger and more intricate with every passing day, making manual diagnosis completely obsolete. When microservices, serverless tasks, and distributed data stores fail, finding the root cause manually consumes valuable engineering hours. Automated troubleshooting bridges this gap by identifying failures, capturing diagnostic context, and applying remediations immediately. Consequently, organizations can maintain high system availability while freeing their technical staff from tedious incident triage.
To build resilient platforms, modern engineering teams partner with specialized leaders like Cloudopsnow to implement intelligent diagnostics. Therefore, establishing automated remediation frameworks requires structured observability, event-driven pipelines, and smart automation engines. When production systems process millions of concurrent transactions, automated diagnostics safeguard reliability without introducing operational friction. This comprehensive guide details the key tools, patterns, and strategies needed to master self-healing cloud ecosystems.
Key Operational Concepts You Must Know
Automated Diagnostic Telemetry and Log Aggregation
Automated troubleshooting begins with centralized telemetry collection across every tier of the modern cloud stack. When distributed services fail, finding anomalies requires structured logs, runtime metrics, and distributed trace contexts. Modern agents automatically capture kernel events, network socket states, and application crash dumps the moment a process degrades. Consequently, operations teams gain instant visibility into underlying system faults without manual intervention.
To turn raw logs into actionable intelligence, log pipelines employ real-time parsing, filtering, and indexing mechanisms. Structured logging standardizes metadata across diverse microservices, ensuring that error traces correlate seamlessly with infrastructure events. Additionally, machine learning models continuously analyze log streams to detect subtle baseline deviations and anomalous patterns. By automating log correlation, platforms dramatically reduce the time needed to isolate transient service failures.
+--------------------------------------------------------------------------------+
|                        AUTOMATED DIAGNOSTIC PIPELINE                           |
+--------------------------------------------------------------------------------+
  [ App Pods / VMs ] ---> [ Telemetry Collector ] ---> [ Event Parser & Router ]
                                                                 |
                                                                 v
  [ Auto-Remediation Trigger ] <--- [ Anomaly Detection Engine (ML/SLO) ]
Event-Driven Auto-Remediation Architecture
Event-driven auto-remediation transforms static observability dashboards into dynamic, responsive maintenance platforms. Instead of waiting for an on-call engineer to review an alert, cloud platforms trigger automated diagnostic routines instantly. Cloud event buses intercept infrastructure state changes, application panics, and threshold breaches to launch serverless execution workflows. Therefore, recurring operational incidents resolve automatically within seconds of initial detection.
These reactive systems utilize fine-grained security policies and least-privilege service roles to execute targeted recovery tasks. For instance, when a worker node exhausts disk space, an automated script clears stale container layers immediately. Similarly, when a deadlock locks a thread pool, the system collects memory heap dumps before restarting the affected container. This systematic approach preserves critical diagnostic data while restoring active application availability instantly.
Distributed Tracing and Root-Cause Isolation
Modern microservices architectures scatter single user transactions across dozens of isolated container instances and serverless functions. When a downstream database dependency slows down, traditional single-server logs fail to reveal the bottleneck. Distributed tracing injects unique correlation identifiers into incoming request headers, tracking calls across every network hop. As a result, automated diagnostic systems isolate failing dependencies and pinpoint root causes with pinpoint accuracy.
- Trace Context Propagation: Transmits unique trace and span IDs across HTTP, gRPC, and message queue boundaries.
- Latency Profiling: Automatically highlights individual spans exceeding predefined duration thresholds in real time.
- Error Tagging: Captures detailed exception stack traces directly inside distributed span metadata.
By analyzing trace dependency graphs, automated diagnostic tools distinguish between upstream service symptoms and true downstream root causes. This prevents cascading alerts from overwhelming engineering teams during widespread multi-tier network degradation. Furthermore, continuous profiling tools pinpoint memory leaks and CPU thread locks inside active production runtimes. Combining distributed tracing with autonomous diagnostic tools ensures rapid, definitive resolution of complex application bottlenecks.
Chaos Engineering and Automated Failure Validation
Chaos engineering proactively injects controlled failures into distributed cloud environments to expose architectural weaknesses before they cause outages. Rather than waiting for unpredicted production failures, teams intentionally simulate network drops, packet corruptions, and node terminations. Automated chaos frameworks validate whether self-healing routines, load balancers, and circuit breakers function as designed. Consequently, engineering organizations build high confidence in their operational resilience.
Automated chaos experiments run alongside continuous deployment pipelines, testing application resilience against realistic failure conditions. These tests monitor steady-state metrics and automatically abort experiments if critical performance thresholds degrade. Additionally, running chaos tests against troubleshooting automation confirms that diagnostic scripts accurately detect and resolve simulated failures. By validating automated runbooks continuously, teams ensure that automated self-healing mechanisms remain dependable during genuine production incidents.
Platform Implementation vs. Culture — What’s the Real Difference?
| Operational Focus Area | Platform Implementation Focus | Cultural & Mindset Focus |
|---|---|---|
| Incident Response | Configuring alerting thresholds, webhooks, and automated recovery runbooks. | Treating production failures as learning opportunities through blameless retrospectives. |
| Infrastructure Management | Enforcing declarative Infrastructure as Code (IaC) and state drift detection. | Practicing shared platform ownership between application developers and operations. |
| System Observability | Installing collection daemons, metric agents, and distributed tracing brokers. | Aligning technical error budgets and SLO definitions with user experience goals. |
| Automation Adoption | Writing automated remediation scripts, serverless triggers, and chaos workflows. | Fostering psychological safety to eliminate manual intervention and accept automation. |
Technical Execution vs. Behavioral Alignment
Platform implementation provides the programmatic framework, automation tools, and cloud configurations necessary to run modern infrastructure. Engineers build automated CI/CD pipelines, configure Kubernetes operators, and write Infrastructure as Code to manage resources reliably. While these technical assets are essential, they only represent the physical scaffolding of modern digital operations. Without deep organizational alignment, even the most sophisticated diagnostic automation fails to deliver meaningful business value.
Conversely, operational culture addresses how engineering teams communicate, handle unforeseen disruptions, and share system responsibilities. A high-maturity culture rejects finger-pointing, choosing instead to analyze systemic process breakdowns after major production incidents. When organizations cultivate transparency and trust, developers willingly instrument their applications with rich telemetry and contextual logging. Therefore, harmonizing technical execution with cultural maturity produces an agile, resilient, and highly productive operational ecosystem.
Bridging the Gap Between Tools and Processes
To maximize operational efficiency, organizations must integrate technical automation directly into daily engineering routines. Deploying advanced observability platforms yields little benefit if team members ignore notification queues or lack standard triage protocols. Similarly, automated self-healing runbooks fail if rigid change-management policies demand manual approval for routine remediations. Thus, forward-thinking organizations adapt their operational workflows to complement automated technical platforms.
       +-------------------------------------------------------------+
       |                  HEALTHY RESILIENCE CULTURE                 |
       |  (Blameless Post-Mortems, Shared Ownership, Continuous QA)  |
       +-------------------------------------------------------------+
                                      |
                                      v
       +-------------------------------------------------------------+
       |                STANDARDIZED OPERATIONAL PROCESS             |
       |     (SLO Monitoring, Event Routing, Runbook Governance)     |
       +-------------------------------------------------------------+
                                      |
                                      v
       +-------------------------------------------------------------+
       |               AUTOMATED DIAGNOSTIC PLATFORM                 |
       |  (Self-Healing Operators, Serverless Hooks, Observability)  |
       +-------------------------------------------------------------+
Building this bridge requires regular operational game days, standard diagnostic practices, and continuous cross-functional technical education. When software developers understand how automated diagnostic tools analyze runtime health, they write modular, fault-tolerant code. This shared technical understanding transforms operations platforms from restrictive environments into flexible systems that accelerate release velocity. Ultimately, uniting human processes with automated infrastructure creates a sustainable foundation for cloud engineering excellence.
Real-World Use Cases of Modern Operations
Autonomous Kubernetes Pod Self-Healing and Diagnostics
In large-scale container platforms running thousands of microservices, manual node troubleshooting creates an unsustainable administrative burden. When a critical container experiences memory leaks or crashes due to unhandled exceptions, automated operators intervene instantly. Instead of simply restarting the failed pod, automated controllers collect memory dumps, capture recent logs, and isolate the node. This process preserves vital debugging evidence before spinning up healthy replacement containers.
[ Unhealthy Pod Detected (OOM/CrashLoop) ]
                   |
                   +---> [ 1. Capture Thread / Heap Memory Dump ]
                   |
                   +---> [ 2. Export Last 1000 Lines of Stdout/Stderr ]
                   |
                   +---> [ 3. Isolate Failing Node / Drain Connections ]
                   |
                   +---> [ 4. Provision Fresh Pod on Healthy Node ]
Furthermore, custom controllers dynamically adjust resource quotas and horizontal scaling parameters when traffic surges create processing bottlenecks. If an ingress controller detects high HTTP 502 error rates, automated routines redirect traffic to fallback endpoints. Meanwhile, diagnostic scripts inspect underlying Linux kernel cgroup constraints to determine whether CPU starvation caused the slowdown. This layered, automated triage resolves container incidents instantly without degrading user experience.
Automated Cloud Security Forensics and Incident Isolation
Modern cloud environments face constant security threats, requiring rapid automated containment to prevent lateral movement. When an intrusion detection system spots suspicious outbound network connections from a virtual machine, automated security playbooks trigger immediately. The automation engine snapshots the instance’s virtual disk, isolates its network security group, and captures active volatile RAM. This autonomous reaction contains potential breaches within milliseconds of initial detection.
- Dynamic Network Quarantine: Modifies security groups instantly to block external communications while keeping forensic access open.
- Forensic Memory Capture: Dumps volatile system RAM to an encrypted storage bucket for offline malware analysis.
- Automated Identity Revocation: Revokes temporary IAM instance credentials immediately to block stolen API access tokens.
By automating these forensic workflows, security teams preserve untampered digital evidence for comprehensive post-incident analysis. Concurrently, automated remediation scripts spin up fresh, patched instances from verified gold images to restore normal operations. This automated balance between rapid threat containment and continuous service availability protects critical enterprise assets effectively.
Self-Healing Multi-Region Database Clusters
Distributed database architectures supporting global business platforms require high resilience against network partitions and regional cloud outages. When a primary database node in one cloud region becomes unresponsive, automated clustering frameworks initiate immediate diagnostic checks. The system validates network connectivity across multiple availability zones to confirm whether the node crashed or suffered a regional partition. Consequently, the cluster avoids split-brain scenarios and maintains full transactional integrity.
[ Primary Database (Region East - Fails) ]
                   |
                   v
[ Multi-AZ Heartbeat & Health Check Validator ]
                   |
     +-------------+-------------+
     |                           |
[ Valid Outage Confirmed ]   [ Network Partition Detected ]
     |                           |
     v                           v
[ Promote Region West Read   [ Pause Local Writes / Enable
  Replica to Primary ]         Safe Read-Only Mode ]
Once the system confirms a hard failure, automated orchestration routines promote a read replica to primary status seamlessly. Dynamic DNS records and connection routing pools update automatically, pointing application traffic to the newly designated master node. Concurrently, diagnostic logs archive the failed node’s transaction journals to determine if disk corruption caused the crash. This continuous, autonomous recovery process ensures uninterrupted data operations for global consumer applications.
Common Mistakes in Operations Engineering
Over-Alerting and Creating Crippling Alert Fatigue
A frequent mistake in operations engineering is configuring aggressive alert thresholds on non-actionable system metrics. When monitoring tools bombard engineers with hundreds of low-severity notifications daily, alert fatigue quickly sets in. Consequently, team members begin ignoring notifications, increasing the likelihood that critical production outages slip through unnoticed. Teams must prioritize actionable alerts that directly affect end-user experience over routine system noise.
Poor Strategy:   [ Raw Metric Drift ] ----> [ Immediate High-Priority Pager Alert ] (Causes Burnout)
Optimal Setup:   [ System Anomaly ] ----> [ Automated Remediation ] ----> [ Aggregated Ticket / Log ]
                                  ----> (If Unresolved) ---------> [ On-Call Pager Alert ]
To resolve this problem, engineering teams should implement symptom-based alerting aligned with explicit Service Level Objectives. If an automated script can restart a degraded service safely, the monitoring system should log the event without paging an engineer. On-call notifications should occur only when automated remediations fail or when user-facing error budgets deplete rapidly. This disciplined approach ensures that engineers respond swiftly and attentively to critical infrastructure emergencies.
Implementing Brittle, Hard-Coded Remediation Scripts
Another major pitfall is deploying rigid, hard-coded troubleshooting scripts that make unchecked assumptions about system environments. Scripts containing hardcoded IP addresses, static resource names, or fixed retry intervals frequently fail during dynamic cloud auto-scaling events. When infrastructure state changes unexpectedly, an unmaintained script can execute destructive commands across healthy production nodes. Therefore, automated troubleshooting tools must remain environment-aware, declarative, and robustly tested.
Operations teams must treat automation runbooks with the same rigor as production application source code. Remediation workflows should use parameterized variables, query dynamic cloud APIs for asset state, and include defensive sanity checks. Furthermore, all diagnostic scripts must undergo strict peer reviews, linting, and automated unit testing in staging sandboxes. Building resilient, context-aware automation prevents remediation tools from worsening active production outages.
Neglecting Diagnostic Data Capture Prior to Remediation
In the rush to restore system availability, operations teams often automate destructive recovery actions without preserving diagnostic context. Automatically rebooting a frozen server or terminating an unresponsive container restores uptime quickly, but it destroys volatile memory states. Consequently, engineers lose the thread dumps, process metrics, and network socket tables needed to find the root cause. Without this underlying evidence, the identical failure pattern inevitably recurs.
Flawed Flow:   [ Degraded Node ] -------------> [ Immediate Reboot ] -------------> [ Evidence Lost Forever ]
Resilient Flow: [ Degraded Node ] ---> [ Auto-Snapshot & Diagnostics ] ---> [ Reboot ] ---> [ Root Cause Identified ]
To avoid this recurring cycle, automated remediation pipelines must capture comprehensive diagnostic snapshots before executing destructive recovery tasks. Automated workflows should dump active process trees, collect network statistics, and archive recent error logs to persistent storage. Once the diagnostic snapshot completes successfully, the platform can safely recycle resources and restore user traffic. This balanced strategy ensures continuous system uptime while providing engineers with the data needed for permanent fixes.
How to Become an Operations Expert — Career Roadmap
Building Mastery in Cloud Networking and Core Operating Systems
To become an elite operations expert, you must first master foundational networking protocols and operating system internals. You must thoroughly understand the Linux kernel, memory management architectures, CPU scheduling algorithms, and network packet lifecycles. Knowing how operating systems handle virtual memory paging, process signals, and file descriptors allows you to troubleshoot complex container failures. This deep knowledge helps you solve tricky issues that high-level management tools obscure.
- Kernel Optimization: Master Linux tracing frameworks like eBPF and
sysctlkernel parameters to analyze socket states and system calls. - Network Protocol Analysis: Study TCP flow control, TLS handshakes, and packet routing using diagnostic tools like
tcpdumpand Wireshark. - Process Debugging: Learn how to analyze thread deadlocks, core memory dumps, and process hierarchies using
gdb,strace, andlsof.
Additionally, study how cloud-native overlay networks, software-defined networking (SDN), and container network interfaces (CNI) route cross-cluster traffic. Understanding these low-level communication layers allows you to design network topologies that minimize packet drops and latency spikes. This foundational technical expertise distinguishes senior infrastructure architects from technicians who rely entirely on graphical cloud dashboards.
Mastering Declarative Infrastructure and Event-Driven Automation
Modern cloud operations require complete codification of infrastructure, making deep expertise in automation platforms an absolute necessity. You should master declarative Infrastructure as Code (IaC) tools like Terraform and OpenTofu to provision cloud environments consistently. Writing modular, immutable infrastructure code eliminates configuration drift and ensures that staging, testing, and production environments remain identical. This technical discipline ensures that automated troubleshooting frameworks function predictably across all environments.
+------------------------------------+
|    INFRASTRUCTURE AS CODE (IaC)    |  <-- Enforces consistent infrastructure
+------------------------------------+
                  |
                  v
+------------------------------------+
|    EVENT-DRIVEN FUNCTION ENGINE    |  <-- Executes dynamic remediation logic
+------------------------------------+
                  |
                  v
+------------------------------------+
|     AUTONOMOUS CLOUD PLATFORM      |  <-- Delivers resilient self-healing
+------------------------------------+
Beyond basic provisioning, you should become highly proficient in scripting languages such as Python and Go to build custom diagnostic tools. Learn to leverage serverless computing platforms and event routers to execute remediation logic in response to cloud events. Developing custom Kubernetes operators and admission webhooks will further allow you to enforce dynamic infrastructure policies at scale. This advanced automation skill allows you to transform repetitive manual runbooks into scalable, self-healing cloud ecosystems.
Implementing End-to-End Observability and Site Reliability Engineering
An operations leader must master modern Site Reliability Engineering (SRE) principles and comprehensive observability practices. You must learn to design and implement observability architectures that correlate metrics, distributed traces, and structured logs into unified diagnostic views. Master industry-standard frameworks like OpenTelemetry, Prometheus, and Grafana to collect rich runtime telemetry from microservices and cloud infrastructure. These tools help you pinpoint the precise root causes of performance degradations and system outages.
- Service Level Objectives (SLOs): Define clear, user-focused SLIs and SLOs to manage error budgets and guide deployment velocity.
- Distributed Telemetry: Instrument application runtimes with OpenTelemetry to track distributed transactions across complex microservice boundaries.
- Automated Runbook Integration: Connect observability alert managers directly to serverless functions and event queues to trigger instant auto-remediations.
Finally, cultivate the organizational skills needed to lead blameless post-mortem investigations and coordinate cross-team incident responses. Learn to turn operational failures into architectural improvements by conducting deep post-incident analysis and capacity planning. By pairing technical observability skills with disciplined SRE methodologies, you will ensure long-term stability across enterprise cloud environments. This complete skill set prepares you to direct mission-critical cloud operations at any scale.
FAQ Section
- What is the difference between automated troubleshooting and automated remediation?Automated troubleshooting focuses on detecting anomalies, collecting diagnostic telemetry, and isolating the root causes of system failures. Automated remediation goes a step further by executing programmatic actions, such as restarting pods or clearing caches, to resolve issues. In modern operations, both systems work together to deliver comprehensive self-healing architectures.
- How does eBPF improve cloud infrastructure troubleshooting?Extended Berkeley Packet Filter (eBPF) allows engineers to run sandboxed diagnostic programs directly inside the Linux kernel without modifying source code. It provides deep visibility into network packet flows, system calls, and file operations with minimal overhead. Consequently, eBPF helps automated tools capture low-level runtime diagnostics without impacting application performance.
- Why are traditional manual runbooks ineffective in modern cloud environments?Traditional manual runbooks rely on human engineers to read documentation, run diagnostic commands, and apply fixes during high-stress incidents. In dynamic, distributed cloud environments, this manual approach is too slow to prevent cascading service outages. Automating these runbooks into event-driven code ensures consistent, rapid responses within seconds of initial failure detection.
- How do distributed tracing tools assist in automated root-cause analysis?Distributed tracing assigns a unique identifier to every incoming request, tracking its path across microservices, databases, and third-party APIs. When an error or latency spike occurs, tracing highlights the exact service and code span responsible for the failure. Automated diagnostic systems use this trace metadata to isolate faulty dependencies and route incidents accurately.
- What safety measures prevent self-healing automation from causing further outages?Resilient automation frameworks use circuit breakers, maximum execution retry limits, and environment sanity checks to prevent runaway remediation loops. Additionally, automated workflows require dynamic state validation and dry-run checks before executing destructive tasks on production resources. If an automated fix fails to resolve an issue within predefined limits, the system halts and pages an engineer safely.
Final Summary
Automating cloud troubleshooting is essential for managing the complexity, scale, and speed of modern distributed software architectures. By replacing slow manual runbooks with event-driven diagnostic workflows, organizations can detect anomalies and restore services within seconds. Success requires a balanced approach that pairs robust telemetry pipelines with declarative infrastructure automation and chaos engineering practices. Ultimately, fostering a blameless, reliability-focused engineering culture ensures that self-healing cloud platforms remain resilient, scalable, and secure.

