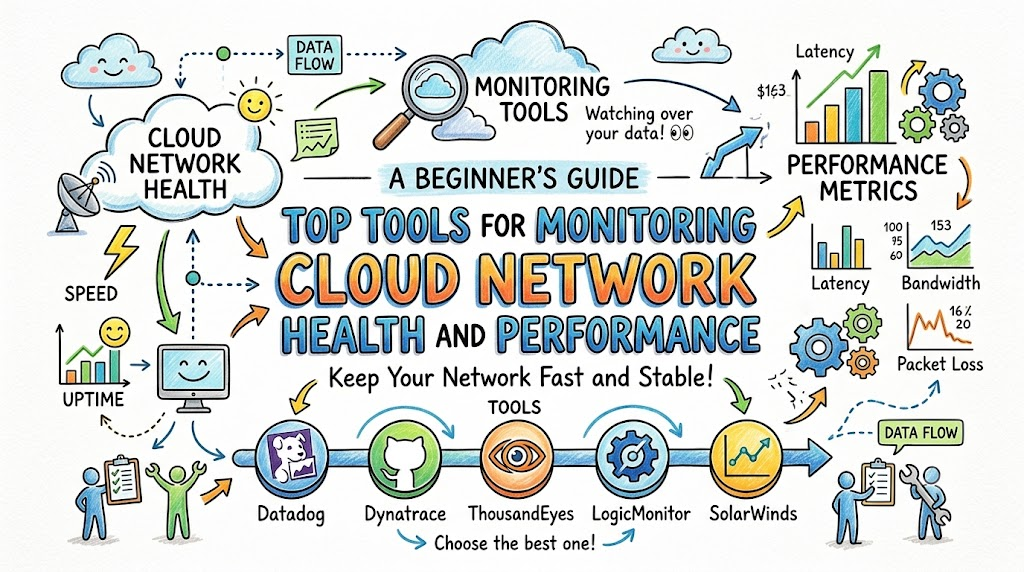
Computers talk to each other across the internet every day. This huge web of connections is the cloud network. Sometimes, these connections slow down or stop working. When that happens, websites break and games lag. Experts use special helper apps to keep everything healthy and fast.
Good teams use services like Cloudopsnow to keep their systems running smoothly. These monitoring tools watch the flow of data every second. They act like doctors for computers. They spot sickness in the network before users feel any pain.
[Your Computer] ---> (Cloud Network Roads) ---> [Website Server]
                               ^
                               |
                   [Health Monitoring Tool]
                   (Checks speed and health)
What Is Cloud Network Monitoring?
A cloud network is like a busy highway for information. Data travels inside tiny digital boxes called packets. If too many packets try to drive on the road at once, traffic jams happen.
Monitoring means watching this digital traffic very carefully. Smart tools track how fast these packets move. They also check if any packets get lost along the way. Next, they send alerts when a road breaks down.
Because of this constant watch, engineers fix problems before users even notice. It saves time and stops angry calls from customers.
Key Operational Concepts You Must Know
Network Latency and Packet Loss
Network latency is the time it takes for data to travel from one place to another. You can think of it as travel time on a trip. Shorter travel times make games and web pages load instantly.
Packet loss happens when bits of data get dropped on the road. Imagine sending five letters in the mail, but only four arrive. When data gets lost, computers must resend it. This makes everything feel very slow.
Healthy:  [Box 1] ---> [Box 2] ---> [Box 3] ---> (Arrived Fast!)
Loss:     [Box 1] ---> [Box 2] -X- (Lost!)  ---> (Must Resend...)
Bandwidth and Uptime
Bandwidth tells you how wide the data highway is. A wider highway lets more cars drive at the same time. But remember, a wide highway does not always mean cars drive faster.
Uptime shows how long a network stays online without crashing. Engineers aim for top scores here. They want systems to work all day and all night without any breaks.
Platform Implementation vs. Culture — What’s the Real Difference?
| Daily Focus Area | Tool Setup (Platform Implementation) | Team Mindset (Culture) |
|---|---|---|
| Fixing Problems | Turn on alert alarms and track computer charts. | Work together kindly to find why things broke. |
| Using Speed Tools | Turn on fast data lanes and set up agents. | Care deeply about fast pages for every user. |
| Learning New Things | Add new helper software to servers. | Share tips freely and teach other team members. |
Tools Are Only Half the Battle
Setting up tools is the technical side of the job. Engineers install software on cloud servers to collect numbers. These tools build colorful dashboards with graphs and dials.
However, tools alone cannot fix a broken team. If workers ignore the alarms, the best software in the world will not help. So, companies need good habits alongside good software.
Building a Healthy Team Culture
A great team talks openly about computer bugs. They do not blame one person when a server stops working. Instead, they sit down and find out what happened together.
Because everyone helps, the whole system gets stronger every week. Good tools give workers facts, but a good culture gives them the courage to fix problems quickly.
Top Tools for Network Health
Datadog Network Performance Monitoring
Datadog is a very popular tool for cloud teams. It tracks data flowing between servers, containers, and cloud zones. It shows nice maps of your entire computer setup.
Engineers use it to see traffic volume between different services. Next, it spots which service talks too much or causes delays. It sends alerts to your phone if a server starts to overheat.
+-------------------------------------------------+
|           Datadog Live View Dashboard           |
+-------------------------------------------------+
| Server A  --> [ 2 ms delay ] --> Server B (OK!) |
| Server C  --> [ 80 ms delay ] -> Server D (SLOW)|
+-------------------------------------------------+
Dynatrace and ThousandEyes
Dynatrace uses smart automation to find hidden errors. It follows every user request from the screen all the way into the database. So, it tells you exactly which computer line has a jam.
ThousandEyes looks at the roads outside your own servers. It tests the public internet pipes across the entire planet. It shows you if an internet company has a broken cable in another city.
Real-World Use Cases of Modern Operations
Online Shopping on Big Sale Days
Online stores get millions of visitors during big holiday sales. If the network slows down, people leave and buy elsewhere. Therefore, teams watch network traffic every second using live graphs.
- Catch traffic spikes: The tools show sudden rushes of visitors in real time.
- Add more servers: Systems add extra servers automatically when roads get full.
- Keep checkouts fast: Monitoring ensures payment data goes through in under one second.
Because of this careful watch, the shopping cart pages never freeze. Families buy their gifts easily, and the store earns more money.
[Rush of Shoppers] ---> [Smart Load Balancers] ---> [10 Fresh Servers]
                               |
                     (No Lines, Fast Sales!)
Online Multiplayer Video Games
Online games need split-second speed. If your actions show up late on the screen, your character loses. Game makers use fast network monitors to check server health near every player.
When an internet path gets slow, the tool finds a faster path. Next, it routes the game moves through the clearer path. This keeps the action smooth and stops annoying screen lag.
Common Mistakes in Operations Engineering
Setting Too Many False Alarms
New engineers often turn on every alert they can find. Then, their phones buzz every two minutes for tiny things. Soon, the workers get tired and ignore the noise.
Too Many Alarms:  BEEP! BEEP! BEEP! (Engineers get tired and turn it off!)
Smart Alarms:     BEEP! (Only rings when something truly needs a fix.)
This bad habit is called alert fatigue. When a real emergency happens, people might miss it completely. So, only set alarms for big problems that need human hands right away.
Watching Only Internal Servers
Another big mistake is looking only inside your own room. Your servers might look green and happy, but your users might still see errors.
The public internet between your servers and your users can break too. If you do not test the paths outside, you will never see the true user pain. Always test connections from the outside looking in.
How to Become an Operations Expert — Career Roadmap
Step 1: Learn Basic Networking
First, learn how computers talk to each other. Learn how IP addresses work, just like home street addresses. Learn how routers direct data packets to the right door.
- IP Addresses: Find out how computers name each other.
- Packets: Learn how files break into tiny puzzle pieces for travel.
- Ping and Traceroute: Use simple commands on your computer to test connection speeds.
Practice these ideas at home on your own Wi-Fi box. When you know the basics, big cloud systems will make total sense.
Step 1: Learn Cables & IPs --> Step 2: Learn Code Tools --> Step 3: Master Dashboards
Step 2: Learn to Automate with Code
Next, learn to write simple computer scripts. Great engineers do not click buttons by hand all day long. They write small programs that set up networks automatically.
Using code makes work faster and stops silly typing mistakes. Also, test different open monitoring tools to see how they gather computer stats. This practical skill helps you stand out in job interviews.
FAQ Section
- Why do cloud networks slow down?They slow down when too many packets try to move through a narrow network pipe at once. Physical distance also causes delays, because data takes time to travel long miles across cables.
- What is an agent in network monitoring?An agent is a tiny helper program you put on your server. It quietly collects health numbers and sends them back to your main dashboard screen.
- Can network tools fix problems on their own?Yes, many modern tools can fix small bugs by themselves. They can reboot a frozen computer or spin up extra servers when traffic jumps.
- What is the difference between ping and latency?Ping is a simple tool that sends a quick test signal to another machine. Latency is the actual time number that the signal takes to return.
Final Summary
Cloud network monitoring keeps modern digital services alive and healthy. Good tools catch small bugs before they turn into giant crashes. By watching packet loss, latency, and uptime, teams protect their users from frustrating delays.
However, tools need a smart team culture to deliver real value. Engineers must avoid noisy alarms and always look at the real user experience. Anyone can master these tools by learning the basics and practicing every day. Start small, keep learning, and build networks that run fast and stay strong.

