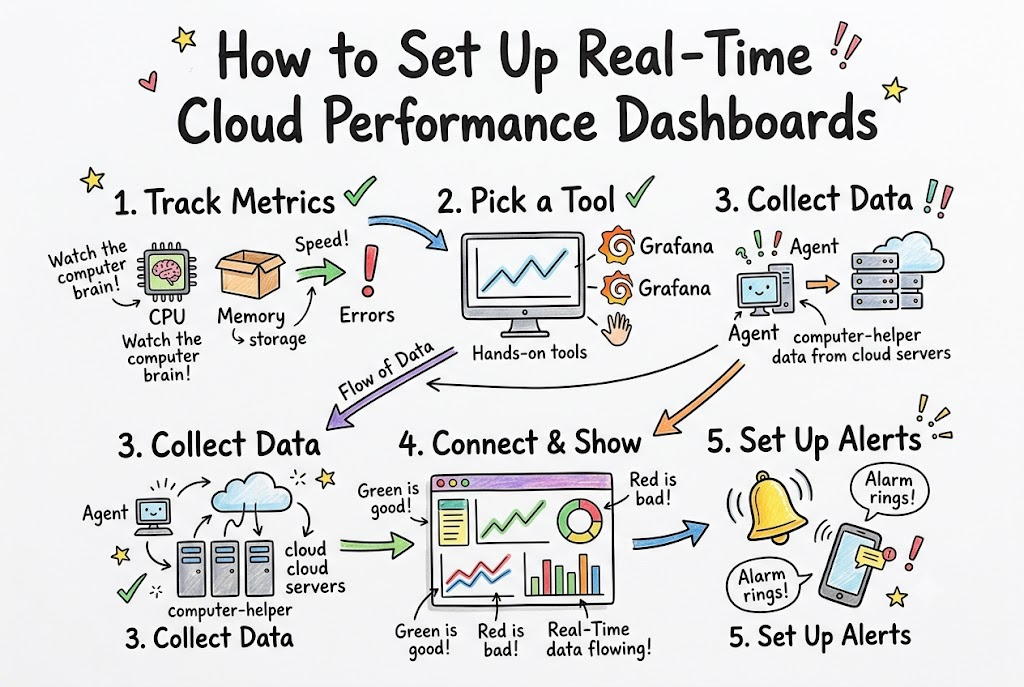
Computers in the cloud run many apps today. Sometimes these computers slow down. We need a way to watch them all day. A live dashboard shows how fast your computers work.
You can get expert help from Cloudopsnow to build these tools. They help teams fix computer problems fast. A good dashboard keeps your apps running smooth and happy.
What Is a Cloud Dashboard?
A dashboard is like the speed screen in a car. It shows how fast your car goes. It also shows how much gas you have left.
In the cloud, a dashboard shows your computer health. It uses colorful charts and lines. You can see your network speed in one place.
Why Real-Time Speed Matters
Real-time means you see things right as they happen. You do not have to wait for an email.
If an app breaks, you see it in one second. Then, you can fix it before users get mad. Fast fixes keep everyone happy.
Pick the Numbers You Want to Watch
First, pick the most helpful numbers to track. Engineers call these numbers metrics. A metric is just a data score.
- CPU Use: This shows how hard the computer brain works.
- Memory Use: This shows how much room is left for apps.
- Network Speed: This shows how fast data moves back and forth.
- Error Count: This shows how many times an app fails.
Next, focus only on your top four scores. Too many charts will confuse your eyes. Keep your screen clean and simple to read.
Choose Your Best Dashboard Tool
Now, pick a good tool to draw your charts. Many great tools exist today.
Popular tools include Grafana and cloud watch boards. These tools take raw numbers and turn them into pretty pictures. They draw red, blue, and green lines that move across the screen.
Also, make sure your tool connects to your cloud servers. Most tools connect with just a few clicks.
Collect Data From Your Cloud Servers
Next, you need to collect data from your computers. You do this with a tiny helper program called an agent.
An agent lives inside each cloud computer. It watches the computer work every second. Then, it sends that data straight to your dashboard.
Because agents are very small, they do not slow down your apps. They just watch, take notes, and report back.
Connect the Data to Your Screen
Now, link your data helper to your screen tool. Open your dashboard tool and add a new data source.
Type in the address of your data collector. Click the test button to check the link. If it turns green, your setup works great!
Next, make your very first chart. Pick a line chart to see speed changes over time. Line charts make it easy to spot sudden drops.
Set Up Loud Alerts for Emergencies
You cannot look at a screen all day and night. So, you must set up automatic alerts.
An alert is like a smoke alarm for your computer. If a server gets too hot, the alarm rings. The tool sends a text message to your team right away.
- Set a warning when CPU use passes eighty percent.
- Sound a big alarm when an app stops completely.
- Send an alert if memory runs out of space.
Because alarms wake people up, use them only for big emergencies. Too many fake alarms will make your team tired.
Share the Dashboard With Your Team
Next, give your whole team access to the screen. Hang a big TV on the office wall. Put the dashboard on that screen for all to see.
When everyone sees the same numbers, teamwork gets much easier. Coders and managers can spot bugs together.
Also, teach your team what each color means. Green means good, yellow means slow, and red means broken.
Test Your Dashboard to Make Sure It Works
Finally, test your brand new dashboard to see it work. You can run a fake test on one server.
Make the test server work extra hard on purpose. Watch your screen to see if the red line goes up. Also, check your phone to see if the alarm text arrives.
If the alarm goes off, your setup is complete. You now have a fast, live dashboard to protect your cloud!

