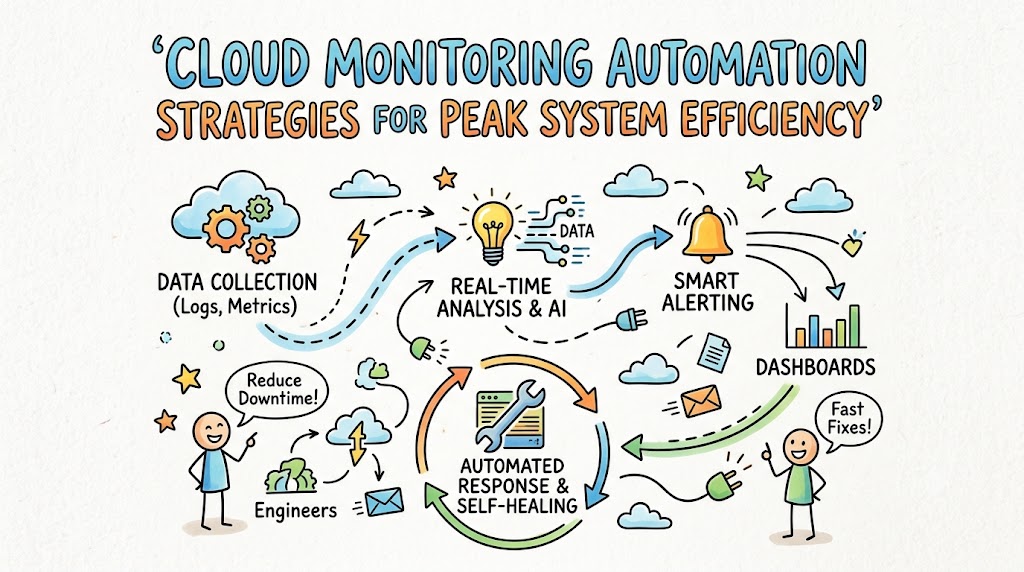
Modern cloud architectures operate at a scale and velocity that manual oversight simply cannot match. When infrastructure spans dozens of microservices, serverless functions, and multi-region databases, performance bottlenecks can arise within seconds. Implementing automated observability frameworks allows engineering teams to detect, diagnose, and resolve system anomalies dynamically. Consequently, automating your cloud metrics collection ensures that digital services maintain peak operational performance without requiring continuous human intervention.
To build an agile, self-healing infrastructure, forward-thinking organizations turn to specialized platforms like Cloudopsnow to design robust automation workflows. By leveraging event-driven triggers, predictive alerts, and automated remediation scripts, operational teams can drastically reduce Mean Time to Resolution (MTTR). When software infrastructure proactively handles traffic spikes and resource constraints, application availability remains steady under extreme workloads. This comprehensive guide details the foundational steps to establish a fully automated cloud monitoring ecosystem.
Key Operational Concepts You Must Know
Defining Automated Observability and Monitoring Loops
Automated monitoring extends traditional telemetry by integrating automated data collection, real-time analysis, and programmatic response mechanisms directly into your cloud architecture. Instead of relying on static dashboards that require manual inspection, automated observability platforms continuously evaluate real-time metrics against historical performance baselines. This continuous loop allows systems to identify emerging degradation trends long before end users encounter service interruptions.
The core mechanics rely on telemetry agents that capture metrics, logs, and trace data directly from operating systems and container runtimes. This data streams into centralized processing engines that execute algorithmic checks to detect abnormal behavior patterns. When a threshold breach occurs, the platform automatically triggers configured webhooks or serverless scripts to fix the issue instantly. This proactive feedback loop minimizes operational fatigue and transforms monitoring from a passive view into an active defense layer.
The Significance of the Four Golden Signals
The Four Golden Signals—Latency, Traffic, Errors, and Saturation—form the fundamental blueprint for evaluating distributed system health effectively. Focusing on these core indicators allows engineering teams to gain immediate clarity regarding application performance without becoming overwhelmed by raw telemetry data. Automating alerts around these four parameters guarantees comprehensive coverage across all operational layers.
- Latency: Measures the exact time taken to service a request, distinguishing between successful and failed requests.
- Traffic: Tracks system demand, such as HTTP requests per second or concurrent transaction volume.
- Errors: Captures the rate of requests that fail, evaluating explicitly returned errors alongside quiet failures.
- Saturation: Assesses resource utilization, highlighting how close a service is to reaching its maximum operational capacity.
Automating data collection across these specific metrics enables operations teams to pinpoint precise root causes when performance degrades. For instance, a sudden surge in traffic coupled with high saturation indicates an immediate need for automated compute scaling. Conversely, high error rates combined with low traffic often point to software bug deployments rather than resource shortages. Prioritizing these signals ensures your automated monitoring stack remains laser-focused on user experience.
Threshold-Based vs. Algorithmic Anomaly Detection
Traditional monitoring systems rely heavily on static, threshold-based rules that trigger alerts when a metric crosses a pre-defined value. While static thresholds work well for predictable workloads, they frequently produce false positives in dynamic cloud environments where traffic fluctuates naturally. Automated cloud monitoring overcomes these limitations by incorporating machine learning models capable of establishing dynamic performance baselines.
Static Threshold:   [ Metric Line ] ------> Breaks Fixed Line ------> [ False Alert ]
Dynamic Anomaly:    [ Metric Line ] ~~~~~~> Stays in Adaptive Band ~~~> [ No Alert ]
Algorithmic anomaly detection analyzes historical trends, day-of-week patterns, and seasonal variations to project acceptable performance ranges dynamically. When current metrics diverge from predicted behavioral corridors, the system triggers targeted alerts that represent genuine operational issues. This intelligent filtering prevents alert fatigue among on-call engineers, ensuring critical warnings receive rapid attention. Consequently, dynamic baseline monitoring creates a significantly more resilient and reliable operational environment.
Automated Remediation and Self-Healing Workflows
Automated remediation converts passive telemetry data into direct system recovery actions without requiring human operator intervention. When monitoring agents detect resource exhaustion or failed health checks, the infrastructure executes pre-scripted recovery procedures automatically. These automated responses restore healthy operational states within seconds, drastically cutting down system downtime.
- Container Recycling: Automatically terminates and replaces unresponsive microservice instances running inside clusters.
- Resource Scaling: Instantly provisions extra compute nodes or memory allocations during unexpected traffic spikes.
- Traffic Rerouting: Dynamically shifts network ingress paths away from degraded regions to healthy infrastructure nodes.
Establishing trusted self-healing workflows requires careful execution testing to prevent runaway automation loops from causing secondary outages. Teams usually begin by automating simple operational tasks, such as clearing temporary log caches or restarting dead background worker threads. As confidence in automated scripts grows, organizations expand self-healing logic to encompass complex multi-service recovery protocols. Ultimately, automated remediation forms the backbone of highly available, modern cloud environments.
Platform Implementation vs. Culture — What’s the Real Difference?
| Operational Aspect | Platform Implementation Focus | Cultural & Mindset Focus |
|---|---|---|
| Alerting Architecture | Configuring notification routers, setting up PagerDuty hooks, and building dashboards. | Emphasizing alert hygiene, eliminating spam notifications, and prioritizing actionable alerts. |
| Automation Tooling | Deploying Terraform modules, writing custom remediation lambda functions, and API integrations. | Encouraging an automation-first approach, valuing engineering time, and rejecting toil. |
| System Reliability | Implementing health check endpoints, auto-scaling groups, and redundant load balancers. | Sharing responsibility for reliability across dev teams and establishing error budgets. |
| Performance Tuning | Optimizing trace sampling rates, configuring metric retention, and managing storage costs. | Fostering continuous learning, treating outages as learning tools, and running blameless post-mortems. |
Technical Execution vs. Behavioral Alignment
Implementing automated monitoring requires deploying sophisticated collection software, metric databases, and event buses across your entire infrastructure stack. Engineers spend significant time writing code to instrument applications, provision telemetry collectors, and build unified visualization dashboards. While these technical components provide necessary operational capabilities, technical tools alone cannot guarantee efficient operations if team habits remain stuck in manual patterns.
Cultural alignment focuses on how engineering teams interpret, respect, and react to automated operational data in their day-to-day work. A strong operational culture treats monitoring code with the same rigor as application features, embedding observability directly into build pipelines. When developers embrace shared operational responsibility, they actively write application code that exposes deep diagnostic metrics natively. Combining reliable platform tooling with a proactive team culture ensures sustainable, long-term system performance.
Bridging the Gap Between Tools and Processes
To maximize the benefits of automated monitoring, technical tools must align seamlessly with daily engineering routines and organizational workflows. Setting up automated anomaly detection engines brings minimal value if response teams lack standard operating procedures for handling alerts. Similarly, self-healing automation scripts can conflict with manual debugging efforts if team communication protocols are unclear. Therefore, operational workflows must be designed to complement technical automation capabilities directly.
   +---------------------------+
   |   Observability Culture   |  <-- Encourages proactive telemetry instrumentation
   +---------------------------+
                 |
                 v
   +---------------------------+
   |   Automated Workflows     |  <-- Defines escalation paths and self-healing rules
   +---------------------------+
                 |
                 v
   +---------------------------+
   |  Monitoring Platform      |  <-- Collects metrics, runs AI analysis, executes code
   +---------------------------+
Building this alignment requires regular review meetings to audit alert effectiveness, refine dynamic thresholds, and document new incident resolution procedures. Teams must treat incident post-mortems as opportunities to automate the manual steps taken during recovery operations. When engineers continuously feed operational learnings back into software configuration files, system resilience improves organically over time. This ongoing alignment transforms basic operational monitoring into a competitive software engineering advantage.
Real-World Use Cases of Modern Operations
Auto-Scaling Microservices Infrastructure in E-Commerce
During peak shopping events, e-commerce platforms experience sudden, unpredictable traffic bursts that stress backend checkout and inventory microservices. Manual infrastructure scaling fails during these rapid traffic spikes, often leading to server crashes and lost transaction revenue. Modern e-commerce platforms overcome this by linking automated cloud monitoring directly to container orchestration platforms like Kubernetes.
[User Traffic Spike] ---> [Load Balancer Metrics] ---> [Metric Collector (Prometheus)]
                                                                |
                                                                v
[App Scale-Out] <--- [Auto-Scaler Triggered] <--- [Threshold Exceeded Rule]
When custom metrics—such as API request queues or database connection pools—exceed safety limits, auto-scaling rules automatically provision new application pods. Simultaneously, automated monitoring scripts increase database read-replica instances to handle rising query loads efficiently. Once traffic volumes return to normal baseline levels, the automated platform scales down excess hardware gracefully to control cloud infrastructure costs. This automated elastic scaling protects user experience while optimizing cloud compute spending.
Proactive Threat Mitigation in Financial Cloud Services
Financial cloud applications require continuous monitoring to identify security threats, unauthorized data exfiltration attempts, and abnormal API consumption patterns instantly. Automated security monitoring setups leverage real-time log analysis engines to examine millions of system events every second. By establishing baseline behavioral profiles for normal user activity, these systems detect suspicious actions immediately upon occurrence.
- IP Rate Limiting: Automatically blocks remote IP addresses displaying brute-force login behaviors or rapid API requests.
- Credential Isolation: Instantly revokes compromised access tokens when unusual geographic access patterns appear.
- Automated Isolation: Moves compromised server instances into isolated network subnets for isolated forensic analysis.
When an automated threat monitoring platform detects anomalous behavior, it executes immediate protective counter-measures through infrastructure webhooks. The system can isolate affected database connections, block malicious IP ranges at the edge firewall, and notify security teams simultaneously. This rapid automated response contains security breaches within seconds, minimizing data exposure risks and maintaining strict regulatory compliance.
Predictive Database Maintenance for SaaS Platforms
Software-as-a-Service platforms rely heavily on consistent database response times to deliver smooth user experiences across multi-tenant environments. Unmanaged database fragmentation, storage exhaustion, or runaway slow queries can degrade performance across an entire customer base rapidly. Operations teams avoid these issues by building automated maintenance workflows driven by predictive monitoring analytics.
[Database Engine] ---> [Storage Analytics Agent] ---> [Predictive Growth Engine]
                                                                |
[Storage Auto-Expanded] <--- [Cloud Storage API] <--- [Capacity Alert Triggered]
Predictive monitoring tools track disk space consumption rates and memory utilization trends, projecting when database resources will reach capacity limits. Before disk space reaches critical levels, automated scripts execute non-disruptive cloud storage expansion commands transparently. Additionally, monitoring engines identify poorly optimized database queries automatically, sending execution plan details directly to developer slack channels. This proactive maintenance model keeps core databases performant without requiring emergency weekend interventions.
Common Mistakes in Operations Engineering
Creating Unfocused Dashboard Noise and Alert Fatigue
A common mistake in cloud monitoring is building cluttered dashboards packed with hundreds of irrelevant graphs and non-actionable metric counters. When operational teams attempt to monitor every low-level system counter simultaneously, identifying genuine performance degradation becomes nearly impossible. This visual clutter leads directly to alert fatigue, causing engineers to ignore critical warnings during major operational incidents.
Cluttered Setup:   [ 100+ Unfiltered Metrics ] ---> [ Constant False Alerts ] ---> [ Alert Ignored ]
Streamlined Setup: [ 4 Golden Signals Only ]    ---> [ Actionable Warnings ]  ---> [ Rapid Fix ]
To prevent this issue, engineering teams should design minimalist dashboards focused exclusively on high-level application health indicators and user experience. Every configured alert must link directly to an actionable runbook detailing explicit steps required for incident resolution. If an alert does not require immediate human intervention or automated script execution, it should be downgraded to a log entry. Keeping notification channels clean ensures that critical operational warnings receive immediate engineering attention.
Neglecting Distributed Tracing in Microservice Architectures
As monolithic applications evolve into distributed microservice architectures, relying solely on isolated server metrics leaves severe diagnostic blind spots. A single user click might trigger dozens of downstream HTTP calls across independent microservices and cloud databases. When response times degrade, traditional infrastructure metrics fail to reveal which specific microservice or network link is causing the delay.
Client Request ---> [Service A] ---> [Service B] ---> [Database Delay] ---> [Slow Response]
                          |               |                  |
                          +---------------+------------------+---> (Traced via OpenTelemetry)
Failing to implement distributed tracing tools prevents operations teams from tracking transaction flows across service boundaries accurately. Implementing open telemetry standards allows systems to attach unique trace IDs to incoming user requests as they traverse downstream components. Automated monitoring systems evaluate these trace spans to highlight hidden network bottlenecks, database lock delays, and serialization issues instantly. Distributed tracing converts complex architectural dependencies into clear, actionable performance insights.
Relying on Default Cloud Provider Metrics Without Context
Many organizations rely strictly on basic, out-of-the-box cloud provider monitoring metrics without adding custom application-level instrumentation. Basic provider metrics cover high-level CPU usage, disk I/O, and network transfer totals, but lack visibility into internal application health. A virtual machine may display perfectly normal CPU usage while internal application thread pools are completely deadlocked.
To gain actionable operational visibility, engineering teams must instrument their software code with custom business and application metrics. Measuring background job processing queues, memory heap fragmentation, and third-party API response times provides true application insight. Custom instrumentation context allows automated monitoring platforms to trigger remediation scripts based on actual application performance rather than deceptive hardware averages.
How to Become an Operations Expert — Career Roadmap
Mastering Telemetry Frameworks and Open Standards
To become an elite operations expert, you must build deep technical knowledge of open-source telemetry standards and data collection architectures. Mastering frameworks like OpenTelemetry allows you to design vendor-neutral instrumentation pipelines across diverse software ecosystems. Understanding how trace propagators, metric exporters, and log collectors function enables you to build scalable observability backbones for complex enterprise architectures.
- Data Collection: Learn to configure high-throughput metric collectors, log aggregators, and distributed trace forwarders.
- Protocol Tuning: Master gRPC and HTTP telemetry transport protocols to minimize monitoring bandwidth overhead.
- Instrumentation APIs: Gain expertise in manual and automatic code instrumentation using standard software development kits.
Additionally, study time-series database engines to understand how metric indexing, downsampling, and storage retention policies operate under heavy data ingest loads. This technical foundation enables you to build custom monitoring infrastructure that scales seamlessly alongside growing application workloads. Deep telemetry mastery ensures you can diagnose system anomalies across any cloud platform confidently.
Implementing Infrastructure as Code for Observability
Modern cloud operations require every piece of monitoring infrastructure to be declared, versioned, and deployed through automated software pipelines. You must master Infrastructure as Code tools like Terraform to manage alert policies, dashboard definitions, and notification channels programmatically. Managing observability configurations as code eliminates manual setup errors, ensures environment consistency, and simplifies disaster recovery scenarios dramatically.
+------------------------+      Applies Code      +------------------------+
|   Terraform / IaC      | ---------------------> |  Standardized Monitoring|
|   Observability Code   |                        |  Dashboards & Alerts   |
+------------------------+                        +------------------------+
Integrating monitoring setups into CI/CD pipelines allows development teams to deploy new software features along with their corresponding alert thresholds automatically. You should design modular monitoring templates that developers can import easily when launching new microservices into production environments. This code-driven operational approach guarantees that every new cloud component arrives fully instrumented from day one. Consequently, your operational coverage expands naturally as system capabilities grow.
Developing Advanced Incident Management and Automation Skills
Becoming a recognized expert requires mastering advanced incident management frameworks, automated remediation workflows, and operational chaos engineering practices. You need to learn how to design robust self-healing scripts that interface securely with cloud management APIs and container orchestrators. Practicing chaos engineering techniques allows you to test automated monitoring scripts proactively by injecting controlled failures into production environments.
             +---------------------------------------+
             |    Chaos Testing Engine (Gremlin)     |
             +---------------------------------------+
               |                 |                 |
               v                 v                 v
        [Inject Latency]   [Terminate Node]  [Fill Storage]
               |                 |                 |
               +-----------------+-----------------+
                                 |
                                 v
             +---------------------------------------+
             |  Automated Remediation Verified       |
             +---------------------------------------+
Focus on developing strategic Site Reliability Engineering (SRE) skills, such as calculating error budgets, establishing Service Level Objectives, and organizing blameless post-mortems. Learn to use incident data to identify recurring operational weaknesses, prioritizing engineering resources toward high-impact automated fixes. This analytical mindset transforms operations from a reactive troubleshooting role into a strategic engineering discipline. Ultimately, combining technical automation skills with strategic leadership elevates your career across the modern cloud industry.
FAQ Section
- What is the difference between cloud monitoring and cloud observability?Cloud monitoring tracks system health by collecting predefined metrics and logs to determine whether a system is working. Cloud observability goes deeper by analyzing internal system states based on external outputs like metrics, logs, and traces. Observability allows teams to infer why a system is failing, even during novel, complex outage scenarios.
- How does automated monitoring reduce Mean Time to Resolution (MTTR)?Automated monitoring cuts MTTR by detecting performance anomalies instantly and pinpointing precise root causes through distributed tracing and metric correlation. Instead of manually inspecting server logs during an outage, engineers receive targeted alerts linking directly to degraded components. Furthermore, self-healing scripts can resolve common issues automatically within seconds of detection.
- What is alert fatigue and how can teams prevent it?Alert fatigue occurs when engineering teams are overwhelmed by frequent, non-actionable, or false alarm notifications, leading to delayed responses during real outages. Teams can prevent alert fatigue by replacing static alert thresholds with dynamic anomaly detection models. Additionally, every alert should require immediate action; non-urgent issues must be logged as background tickets instead.
- Why is distributed tracing essential for microservices monitoring?Microservices architectures process single user requests across multiple independent network nodes and backend databases simultaneously. Traditional server metrics cannot isolate which specific service component in a complex call chain is causing performance delays. Distributed tracing assigns unique identifiers to requests, allowing engineers to visualize data paths and spot bottlenecks instantly.
- How do self-healing systems handle automated recovery safely?Self-healing systems execute pre-scripted recovery actions—such as restarting dead containers or scaling compute capacity—when monitoring triggers occur. To run safely, these systems utilize circuit breakers, execution rate limits, and safety timeouts to prevent endless automation loops. If automated remediation fails within a specified window, the system escalates the incident directly to human engineers.
Final Summary
Automating cloud monitoring transforms passive system observation into an active, self-healing performance framework. By focusing on essential metrics like the Four Golden Signals, replacing static limits with dynamic baseline models, and embedding automated recovery actions, organizations maintain reliable application experiences. Eliminating manual troubleshooting through automated distributed tracing and code-driven monitoring infrastructure allows platforms to handle massive user loads effortlessly. Embracing automated cloud monitoring ensures your digital infrastructure remains resilient, highly performant, and fully prepared for modern business demands.
