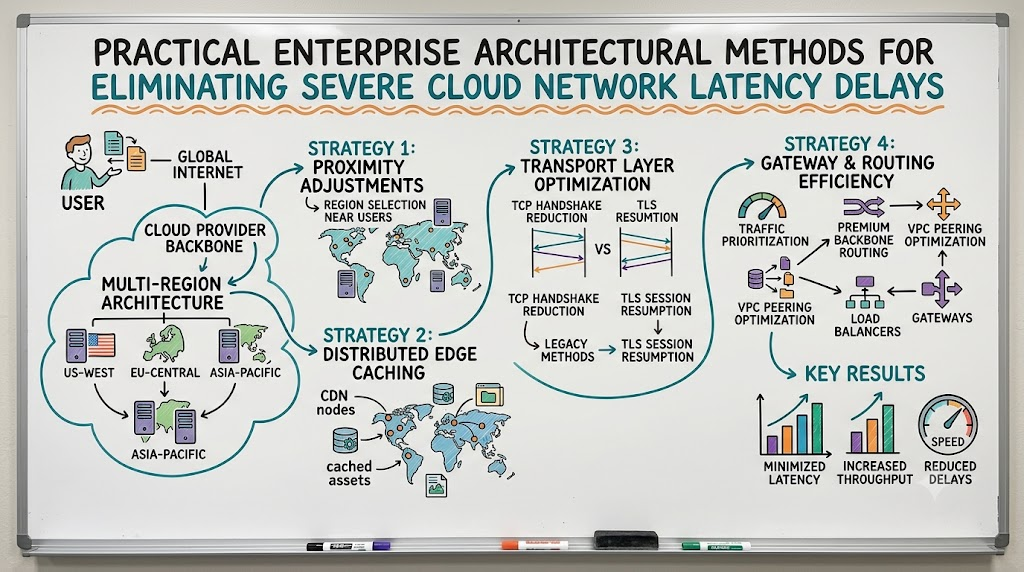
Cloud environments provide unmatched scalability, yet unexpected network latency frequently cripples digital application workflows. When data packets encounter congestion or traverse inefficient routes, response times degrade and directly hurt user satisfaction. Consequently, diagnosing and mitigating these delays quickly represents a vital operational requirement for modern technology teams. By adopting structured diagnostic workflows and applying high-impact configuration adjustments, engineers can swiftly restore rapid data throughput.
To achieve lasting system responsiveness, forward-thinking enterprises partner with specialized service providers like Cloudopsnow to architect resilient cloud topologies. Furthermore, resolving acute lag requires an integrated methodology that addresses underlying transport bottlenecks, suboptimal geographic placements, and localized resource constraints. When thousands of concurrent transactions stall simultaneously, structured troubleshooting eliminates performance degradation before revenue drops. This detailed guide demonstrates practical, production-tested techniques to diagnose, isolate, and resolve cloud latency issues rapidly.
Identifying Core Drivers of Severe Cloud Latency
Network latency rarely stems from a single isolated failure; instead, it accumulates across various physical and logical layers. Physical propagation delay establishes the baseline floor because signals cannot travel faster than the speed of light through glass fibers. Furthermore, every router, firewall, and NAT gateway adds processing overhead as packets undergo serialization and security inspections. When teams understand these distinct transit stages, they can accurately classify whether delays originate from infrastructure, protocol handshakes, or application logic.
Additionally, internal virtual private cloud (VPC) peering arrangements and poorly sized virtual gateways frequently produce artificial throughput choke points. When data must traverse multiple transit gateways between regions, latency compounds with each intermediate network hop. Similarly, overloaded hypervisors and saturated virtual network interfaces introduce packet drops that trigger costly TCP retransmissions. By breaking down the end-to-end network path into distinct segments, engineers can systematically eliminate suspects and target the genuine source of delay.
Immediate Triage Techniques for Cloud Network Spikes
When an unexpected latency spike occurs in production, rapid diagnostic isolation prevents prolonged service downtime. First, engineers must distinguish between network transport delays and backend database or application processing bottlenecks. Utilizing synthetic probes alongside distributed tracing allows teams to pinpoint the exact hop where latency begins to rise. Consequently, running real-time traceroutes and measuring transmission percentiles reveals whether public internet carriers or internal cloud fabrics cause the issue.
Next, operations teams should inspect connection connection limits, connection pool exhaustion, and network address translation (NAT) gateway port saturation. If an application opens thousands of external API calls simultaneously, SNAT port allocation can instantly exhaust, dropping outbound packets. In such urgent emergencies, immediately scaling out gateway instances or provisioning secondary NAT gateways relieves connection pressure within minutes. This swift intervention stabilizes the environment while engineers prepare permanent architectural remediations.
Optimizing Gateway Routing and Transport Protocols
Transport protocol overhead often accounts for a substantial percentage of total transaction latency in distributed cloud setups. Traditional TCP connections require a three-way handshake, and adding TLS encryption introduces additional round trips before data flows. Transitioning public-facing APIs to modern protocols like HTTP/3 with QUIC combines connection establishment and security negotiation into a single round trip. Therefore, modernizing your transport layer yields immediate speed improvements without requiring complex application code rewrites.
Moreover, intelligent gateway routing eliminates erratic public internet transit paths that expose traffic to unpredictable carrier congestion. Cloud providers offer dedicated global backbones that ingest user traffic at nearby edge points of presence rather than traversing open lines. Routing client traffic directly into private fiber networks guarantees consistent packet delivery and significantly reduces jitter. By tuning load balancer algorithms and enabling connection multiplexing, operations teams maximize channel efficiency and streamline packet flow.
Distributed Edge Caching and Proximity Adjustments
Physical distance remains an immutable constraint, making geographic proximity the ultimate lever for reducing perceived latency. If your primary compute cluster resides in North America while active users query from East Asia, high latency is inevitable. Deploying modern Content Delivery Networks (CDNs) caches both static assets and cacheable dynamic API responses near end users. As a result, edge nodes resolve the vast majority of incoming requests locally, bypassing lengthy cross-continental network journeys.
For read-heavy and latency-sensitive microservices, implementing regional read replicas and edge compute runtimes delivers exceptional performance dividends. Running lightweight compute functions at edge points allows authentication, input sanitization, and request routing to execute immediately adjacent to the user. Meanwhile, background replication mechanisms keep core databases synchronized without blocking frontend operations. This multi-tier architecture slashes response latencies from hundreds of milliseconds down to single-digit measurements.
Key Operational Concepts You Must Know
Network Serialization, Propagation, and Switching Delays
To optimize cloud systems effectively, engineers must master the fundamental components that dictate end-to-end packet delivery speeds. Propagation delay measures the physical time taken for light signals to travel across optical cables between distant regions. Conversely, serialization delay reflects the time needed to write individual data bits onto physical network mediums, depending on link capacity. Finally, switching and queuing delays occur when network hardware buffers incoming packets during periods of heavy congestion.
- Propagation Delay: Dictated by geographic separation; reduced by establishing resources closer to users.
- Serialization Delay: Governed by port bandwidth; minimized by upgrading interface capacities and reducing payload footprints.
- Queuing Delay: Caused by router buffer congestion; eliminated through traffic shaping and proactive capacity scaling.
When cloud workloads experience sudden traffic surges, queuing delays inside software-defined network interfaces skyrocket rapidly. Consequently, packets wait in memory queues before hypervisors can forward them to container runtimes. Understanding these low-level interactions helps engineers look beyond simple bandwidth upgrades and address the true structural causes of system latency.
The Dynamics of Round-Trip Time and Jitter
Round-Trip Time (RTT) represents the full duration required for a data packet to travel to its destination and return acknowledgment. Jitter measures the statistical variance in packet arrival intervals, indicating fluctuating network conditions and instability. In interactive applications and real-time streaming platforms, severe jitter degrades performance even more severely than static high latency. Therefore, operational monitoring must treat RTT and jitter as interconnected metrics during system evaluation.
Client Request  ===============> (Transit Network) ===============> Server Processing
       ^                                                                   |
       |                                                                   v
Client Receive  <=============== (Transit Network) <=============== Server Response
|============================== Total RTT =========================================|
Network engineers track RTT changes across specific transit corridors to detect routing changes imposed by autonomous transit providers. If intermediate carriers alter border gateway protocol routes, packet paths can double in physical length without warning. Continuous ping telemetry and synthetic transaction probing capture these route shifts immediately. Keeping baseline RTT consistent across all availability zones ensures steady application behavior under variable loads.
TCP Windowing, Bufferbloat, and Packet Loss
The Transmission Control Protocol relies on sliding window mechanisms to balance data transmission rates against receiver processing capabilities. When a sender transmits data faster than intermediate network equipment can process, network buffers fill completely, causing bufferbloat. This condition inflates latency massively because packets linger in hardware buffers instead of being dropped to signal congestion. Consequently, high buffer latency mimics packet loss and forces unnecessary application timeouts.
To overcome bufferbloat, modern cloud platforms employ advanced congestion control algorithms such as BBR (Bottleneck Bandwidth and RTT). Unlike legacy algorithms that infer congestion only after packet drops occur, BBR actively models network capacity and minimum transit time. Adopting modern congestion algorithms stabilizes transmission speeds and prevents connection stalls on high-bandwidth, high-latency links. This optimization ensures that cloud servers maintain peak data throughput without saturating network buffers.
Service Meshes and Internal Inter-Service Latency
Microservice architectures improve application modularity, but they introduce extensive internal network traffic across distributed private subnets. When a single user action triggers multiple synchronous HTTP calls across distinct services, internal latency compounds rapidly. Implementing a service mesh introduces sidecar proxies that intercept, inspect, and route every internal request. While this adds minor processing overhead, it delivers vital traffic management capabilities such as automated retries and mutual TLS encryption.
[User Request]
      |
      v
[API Gateway]
      |
      +---> [Service A Proxy] ---> [Service A Container]
                   | (Internal Mesh mTLS)
                   v
            [Service B Proxy] ---> [Service B Container]
To prevent internal service meshes from inflating latency, operations teams must tune proxy configurations and enable connection reuse. Leveraging high-performance inter-process communication protocols like gRPC instead of standard REST over HTTP/1.1 slashes internal serialization overhead. Furthermore, deploying related microservices into shared availability zones minimizes intra-datacenter transit times. These operational practices keep internal communication swift, scalable, and manageable.
Platform Implementation vs. Culture — What’s the Real Difference?
| Operational Dimension | Platform Implementation Focus | Cultural & Organizational Focus |
|---|---|---|
| Architectural Design | Provisioning multi-region networks, load balancers, and global transit gateways. | Prioritizing user experience over development convenience during design discussions. |
| Telemetry & Alerts | Installing distributed tracing frameworks, metric collectors, and alert monitors. | Establishing team accountability for Service Level Objectives and reviewing error budgets. |
| Failure Resolution | Automating failover sequences, health probes, and dynamic traffic redirection. | Conducting blameless post-mortems to discover structural process vulnerabilities. |
| Resource Efficiency | Configuring auto-scalers, instance types, and automated network policies. | Championing continuous performance tuning as an essential daily engineering value. |
Technical Infrastructure vs. Engineering Mindset
Platform implementation represents the concrete assembly of hardware instances, software routers, and automation scripts that deliver digital services. Engineers spend countless hours configuring infrastructure code, setting firewall parameters, and provisioning container clusters. While these technical assets are indispensable, they simply constitute the engine of an organization’s technology infrastructure. Without an informed team steering the architecture, technical systems quickly fall into disorganization and inefficiency.
In contrast, engineering culture reflects the collective mindset, habits, and operating principles that guide daily development decisions. A mature operational culture treats performance optimization not as an afterthought, but as an essential design criterion. When developers understand how excessive external API dependencies cause cascading network latency, they instinctively write more efficient code. Therefore, uniting technical capabilities with a performance-conscious mindset creates an agile, durable technology organization.
Aligning Team Habits with System Automation
Advanced automation tools deliver negligible value if organizational workflows remain siloed and sluggish. For example, automated canary deployment systems cannot prevent latency regressions if development teams routinely disable synthetic performance checks. Similarly, expansive monitoring dashboards provide little benefit when engineers ignore non-critical latency warnings. Consequently, engineering leaders must construct clear processes that turn automated signals into immediate team actions.
   +------------------------------------+
   |   Empowered Performance Culture    |  <-- Values fast, reliable user journeys
   +------------------------------------+
                     |
                     v
   +------------------------------------+
   |  Standardized Operational Habits   |  <-- Enforces performance budgets and SLOs
   +------------------------------------+
                     |
                     v
   +------------------------------------+
   |   Automated Platform Tooling       |  <-- Executes routing, scaling, and recovery
   +------------------------------------+
Establishing continuous collaboration between software developers and site reliability engineers bridges this operational gap effectively. Regular architecture reviews ensure that network latency implications receive rigorous evaluation before new services enter production pipelines. Moreover, incorporating latency thresholds directly into deployment validation checks stops slow code from ever reaching end users. This cultural alignment elevates automated platforms from mere operational mechanisms into business accelerators.
Real-World Use Cases of Modern Operations
High-Volume Video Conferencing and Media Platforms
Real-time interactive video platforms demand ultra-low latency and minimal jitter to deliver natural, interruption-free communication experiences. A sudden network delay of merely one hundred milliseconds causes noticeable audio clipping and disruptive visual artifacts. To maintain smooth delivery, streaming platforms deploy distributed media relay servers at the extreme edge of global networks. This arrangement ensures that media streams travel short distances between participants rather than traversing distant central servers.
[Participant 1] ---> [Regional Edge Media Relay] <--- [Participant 2]
                             |
                   (Synchronized Telemetry)
                             v
                 [Central Control Cluster]
Furthermore, operations engineers utilize custom UDP protocols combined with selective forwarding units to manage individual video streams dynamically. When an individual participant experiences network degradation, the media platform automatically lowers transmission resolution without interrupting audio delivery. Additionally, automated route optimization systems monitor global internet health and steer traffic away from congested transit providers instantly. These sophisticated operational techniques maintain crisp video communication across volatile consumer networks.
Large-Scale Fintech and Payment Gateways
Financial transaction networks process billions of dollars daily, where delayed transaction confirmations directly degrade customer trust. Payment gateways must authenticate requests, run fraud detection algorithms, and communicate with legacy banking ledgers within fractions of a second. To achieve this speed, fintech operations teams construct dedicated private interconnects that link cloud environments directly to financial processing centers. These private links bypass the public internet entirely, guaranteeing consistent low-latency packet delivery.
- Dedicated Cloud Interconnects: Provides consistent single-digit millisecond latency between cloud VPCs and core banking rails.
- In-Memory Ledger Caches: Accelerates account validation and balance inquiries before dispatching network settlement calls.
- Asynchronous Risk Processing: Runs computationally heavy compliance checks in parallel to avoid blocking critical payment pathways.
Additionally, financial engineering teams locate their fraud analysis microservices inside identical cloud zones alongside main transaction processing engines. By co-locating these systems, internal communication delays remain below two milliseconds, enabling deep transaction inspections in real time. Rigorous connection pooling and persistent TLS sessions between services eliminate handshake overhead during critical payment processing windows. This meticulous operational discipline ensures both uncompromised security and instantaneous transaction clearance.
Massive Multiplayer Online Gaming Backends
Multiplayer online gaming titles require millisecond-level state synchronization across geographically diverse player populations to ensure fair gameplay. High network latency introduces desynchronization bugs, giving players with faster connections an unfair competitive advantage. To level the playing field, gaming studios deploy fleets of stateless game servers across dense edge computing clusters. This infrastructure topology brings game logic into close physical proximity with competitive player bases worldwide.
[Global Gamers]
       |
       +---> [Anycast Edge VIP] ---> [DDoS Scrubbing Layer]
                                             |
                                             v
                             [Edge Game Server Instance]
                                             |
                                 (Periodic State Sync)
                                             v
                             [Central Game State DB]
Engineers implement Anycast routing to automatically direct each player’s client software to the closest operational game server instance. Behind these Anycast endpoints, high-performance UDP routing engines process player movement packets without waiting for transmission acknowledgments. When sudden packet loss occurs across regional transit corridors, automated traffic managers migrate active matches to alternative servers seamlessly. This proactive management guarantees a responsive, stable gaming environment for competitive communities everywhere.
Common Mistakes in Operations Engineering
Overlooking DNS Propagation and Resolver Latency
An exceptionally common yet frequently ignored source of cloud latency involves unoptimized Domain Name System (DNS) configurations. Every new external request begins with a DNS lookup to resolve hostnames into actionable IP addresses. If an organization relies on misconfigured nameservers or sets excessively low Time-To-Live (TTL) values, clients execute recursive lookups repeatedly. These lookups add hundreds of milliseconds of delay before any application connection can even initialize.
Client Lookup --------> [Uncached Slow Resolver] --------> [Root Nameserver] (High Delay)
Client Lookup --------> [Anycast Edge DNS Cache] -------------------------> (Instant Response)
To resolve this issue, operations teams should deploy Anycast-enabled DNS hosting services that answer user queries from nearby points of presence. Furthermore, configuring appropriate TTL durations ensures that client devices and intermediate resolvers cache DNS records efficiently. Utilizing modern capabilities like DNS query pipelining and geo-routing directs users to the most responsive regional endpoint instantly. Eliminating DNS resolution friction provides an immediate, noticeable boost to overall application delivery speeds.
Mismanaging Connection Pooling and Keep-Alive Headers
Another pervasive engineering mistake is failing to configure connection pooling and HTTP keep-alive settings on cloud load balancers and internal proxies. When applications establish a fresh connection for every single transaction, system resources waste considerable time executing repetitive handshakes. Over multiple microservice interactions, these continuous connection initializations accumulate significant operational latency. Consequently, systems experience high CPU utilization and poor response times even under modest traffic volumes.
Operations teams must enforce strict keep-alive policies across all load balancers, reverse proxies, and internal application connection pools. Reusing existing TCP and TLS connections allows subsequent requests to transmit payloads immediately without repeating handshakes. Furthermore, tuning connection idle timeouts prevents hypervisors from holding zombie connections while ensuring that connections remain active for regular traffic. This simple configuration adjustment dramatically accelerates request handling across complex distributed applications.
Ignoring Egress Traffic Bottlenecks and Virtual NAT Limits
Many cloud architectures suffer from hidden throughput bottlenecks created by misconfigured network address translation gateways and egress routes. Default NAT gateway implementations enforce firm bandwidth caps and concurrent connection limits on outbound traffic. When large batch data transfers coincide with spikes in public API calls, NAT interfaces saturate, forcing packets into long queues or dropping them entirely. These dropped packets trigger aggressive retransmissions that cripple external communication latency.
[Multiple App Containers] ---> [Single Saturated NAT Gateway] === (Packet Drops & High Delay) ===> [Internet]
[Distributed App Subnets] ---> [Multi-AZ Scaled NAT Gateways] === (Smooth Rapid Throughput)  ===> [Internet]
To eliminate egress bottlenecks, engineers should deploy independent, auto-scaling NAT gateways across each availability zone within their cloud network. Additionally, implementing cloud provider endpoint services allows private subnets to communicate directly with native services without routing traffic through public NAT gateways. This architectural adjustment routes sensitive data over dedicated internal cloud backbones, bypassing public internet chokepoints entirely. Proactively managing egress traffic paths keeps internal and outbound data flows consistently rapid.
How to Become an Operations Expert — Career Roadmap
Mastering Fundamental Network Layers and Diagnostics
To become an authoritative operations expert, you must first master the fundamental networking mechanics that govern computer communications. Develop a granular understanding of the seven layers of the OSI model, focusing intently on transport and network protocols. You must understand how IP routing operates, how autonomous systems exchange routes via BGP, and how TCP flow control functions under stress. This deep technical grounding gives you the diagnostic skills to troubleshoot failures that modern abstractions obscure.
- Protocol Analysis: Practice inspecting raw packet flows with tools like Wireshark and
tcpdumpto diagnose packet drops. - Kernel Network Tuning: Learn to adjust Linux network stack socket buffers, queue lengths, and epoll settings for maximum throughput.
- Diagnostic Tooling: Gain fluency with advanced diagnostic utilities such as
mtr,iperf3, andethtoolto isolate network bottlenecks.
Moreover, examine how modern virtualization and container runtimes encapsulate network traffic using overlays like VXLAN and GENEVE. Understanding the processing overhead introduced by virtual bridges and software-defined packet processing helps you design highly performant container networks. This low-level proficiency elevates your engineering ability, enabling you to build infrastructure that operates with exceptional speed and reliability.
Architecting Resilient and Automated Cloud Environments
Modern infrastructure operations demand complete mastery of programmatic automation and declarative Infrastructure as Code (IaC). You should achieve deep expertise in tools like Terraform to define, version, and deploy complex cloud architectures predictably. Writing modular, automated code allows you to spin up identical, multi-region networking environments across diverse geographic regions without manual human error. This systematic consistency guarantees that network topologies, routing tables, and security perimeters perform predictably in every deployment.
+---------------------------+       Applies Code       +------------------------------+
|   Terraform IaC Codebase  | -----------------------> | Multi-Region Cloud Network   |
|   (Version-Controlled)    |                          | (Predictable Low Latency)    |
+---------------------------+                          +------------------------------+
Beyond basic provisioning, focus on mastering automated CI/CD pipelines to validate infrastructure updates through comprehensive integration tests before production releases. Incorporate automated configuration compliance scanners to verify that network settings adhere to defined corporate performance standards. Automating these quality checks reduces configuration drift and eliminates performance regressions caused by unexpected manual edits. As a result, your organization can iterate swiftly while maintaining a secure, lightning-fast cloud infrastructure.
Building Comprehensive Observability Systems
An elite operations specialist must establish deep, real-time observability across distributed and multi-cloud environments. You must become proficient in collecting, aggregating, and correlating telemetry data across metrics, distributed traces, and structured log streams. Master observability platforms like Prometheus, Grafana, and OpenTelemetry to visualize traffic patterns and trace request paths across complex microservice architectures. These modern tools allow you to pinpoint the exact network hop or software dependency that causes performance degradation.
                   +---------------------------------------------+
                   |     Unified Operations Cockpit (Grafana)    |
                   +---------------------------------------------+
                     ^                      ^                  ^
                     |                      |                  |
             [Prometheus Metrics]   [OpenTelemetry Traces]  [Structured Logs]
             (Network Throughput)   (Hop-by-Hop Latency)    (Kernel & App Logs)
Furthermore, learn to design actionable Service Level Indicators (SLIs) and realistic Service Level Objectives (SLOs) centered squarely around user satisfaction. Train yourself to filter out routine background noise, designing intelligent alerting policies that alert on-call teams only during genuine service anomalies. This focused monitoring prevents alert fatigue and ensures rapid response when critical latency incidents occur. Transforming raw network telemetry into clear, actionable insights represents the ultimate hallmark of a true operations leader.
FAQ Section
- What is the fastest way to identify whether latency comes from the network or the application?Engineers should measure Time to First Byte (TTFB) and compare it directly against the network Round-Trip Time (RTT). If ping and traceroute tests show a small, stable RTT while TTFB remains excessively high, the application code or database query engine causes the delay. Conversely, a high baseline RTT confirms that the delay occurs within the network transport layer.
- Why does physical distance have such an enormous impact on cloud latency?Data packets cannot travel faster than the speed of light through optical fiber cables, establishing an unchangeable physical propagation delay. Every thousand miles of physical separation introduces noticeable transit delay, which compounds across bidirectional handshakes. Deploying resources across distributed edge nodes and local cloud regions minimizes this geographic travel time.
- How does HTTP/3 reduce connection establishment latency compared to HTTP/2?HTTP/3 utilizes the QUIC transport protocol over UDP, merging the transport handshake and cryptographic security negotiation into a unified process. This modern design establishes secure connections in a single round trip, and in many cases allows zero-RTT connection resumption. Consequently, clients connect and transmit requests far faster, especially over unstable cellular or long-distance networks.
- Can increasing cloud server instance sizes fix persistent network delays?Increasing instance sizes only resolves latency if the root cause involves local CPU exhaustion, memory shortages, or hypervisor network throttling. If delays originate from physical distance, complex routing hops, or public internet congestion, expanding compute resources leaves performance completely unchanged. You must diagnose the precise source of delay before spending budget on larger instances.
- What is the practical impact of enabling TCP BBR congestion control?TCP BBR analyzes available network bandwidth and transit delays continuously to transmit data at optimal physical speeds without saturating intermediate buffers. Unlike legacy loss-based congestion control algorithms, BBR avoids severe throughput drops when minor packet loss occurs. Enabling BBR at the operating system level results in higher throughput and significantly lower latency across congested networks.
Final Summary
Eliminating severe cloud latency demands a balanced engineering approach that pairs deep protocol knowledge with disciplined architectural practices. By systematically analyzing the root causes of packet delays, operations teams can implement high-impact fixes that yield immediate performance gains. Strategic enhancements—such as adopting modern transport protocols, optimizing routing gateways, and deploying distributed edge caching—consistently resolve painful network delays. Ultimately, cultivating an engineering culture that treats low latency as a non-negotiable standard guarantees responsive, dependable, and high-performing digital services.
